Summary
- Since the beginning of 2022, the Cboe Volatility Index® (“VIX”) futures curve has shifted higher, indicating that expectations for volatility in the market remain elevated.
- A state of contango represents the expectation that the VIX index will increase from its current level moving forward.
- When the VIX futures curve does go into backwardation it could signal weakness and overall risk in the market but the market can recover quickly.
Since the beginning of 2022, the Cboe Volatility Index (VIX) futures curve has shifted higher, indicating that expectations for volatility in the market remain elevated. In fact, the 200 Day Simple Moving Average has risen from 18.59 on January 3rd to its current level of 24.03, a 29% increase. But what has happened to the shape of the VIX futures curve and how might this be a precursor of market performance?
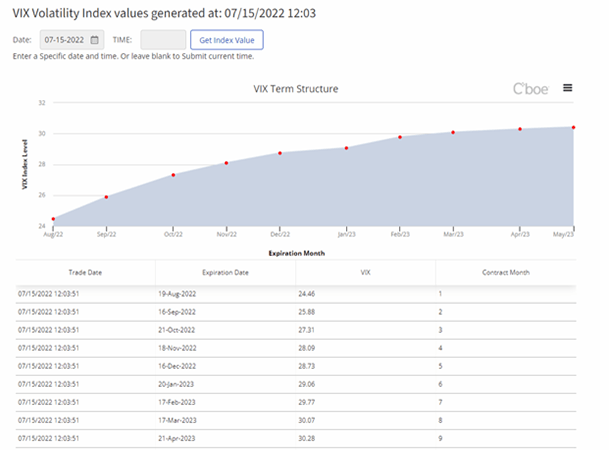
The VIX Index is a financial benchmark designed to be a market estimate of expected 30-day volatility of the S&P 500 Index® and is calculated from both call and put options. It represents the expected range of movement (not necessarily direction), over the next 30 days. There are numerous VIX futures maturity dates and the VIX futures term structure is the relationship between VIX futures prices and VIX futures maturity dates. When a futures curve is trading in its “normal” pattern, it is said to be in contango, meaning the shape of the curve is upward sloping from left to right. Applied to the VIX futures, the VIX futures curve is in contango when near-term VIX futures are cheaper than longer-term VIX futures.
Here is an example of the VIX futures curve on July 15th:
Term Structure Data and Implied Volatility of Options on the S&P 500
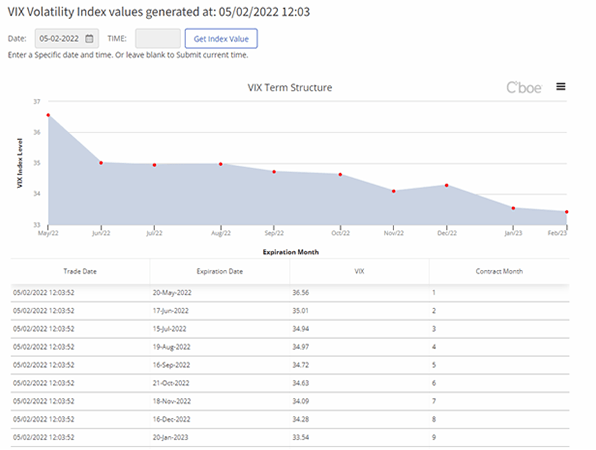
The opposite situation occurs when near-term futures are more expensive and the shape of the futures curve becomes downward sloping and is known as backwardation. This may happen when near-term market conditions have more uncertainty than the longer term and hedging becomes more expensive (from a volatility standpoint) in the short term. Backwardation is not as common in the VIX futures curve as contango and happens less than 20% of the time since 2010. Periods of backwardation also tend not to last as long as periods of contango.
Here is an example of the VIX futures curve on May 2nd:
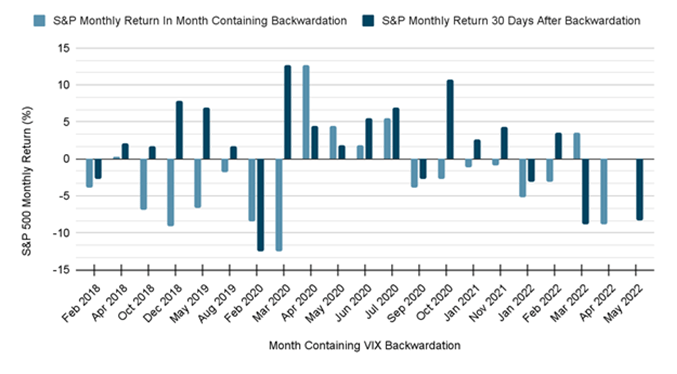
The below chart shows the number of times the VIX futures curve has been in backwardation since 2018 and the S&P 500 30-day return following the month of the backwardation:
Comments