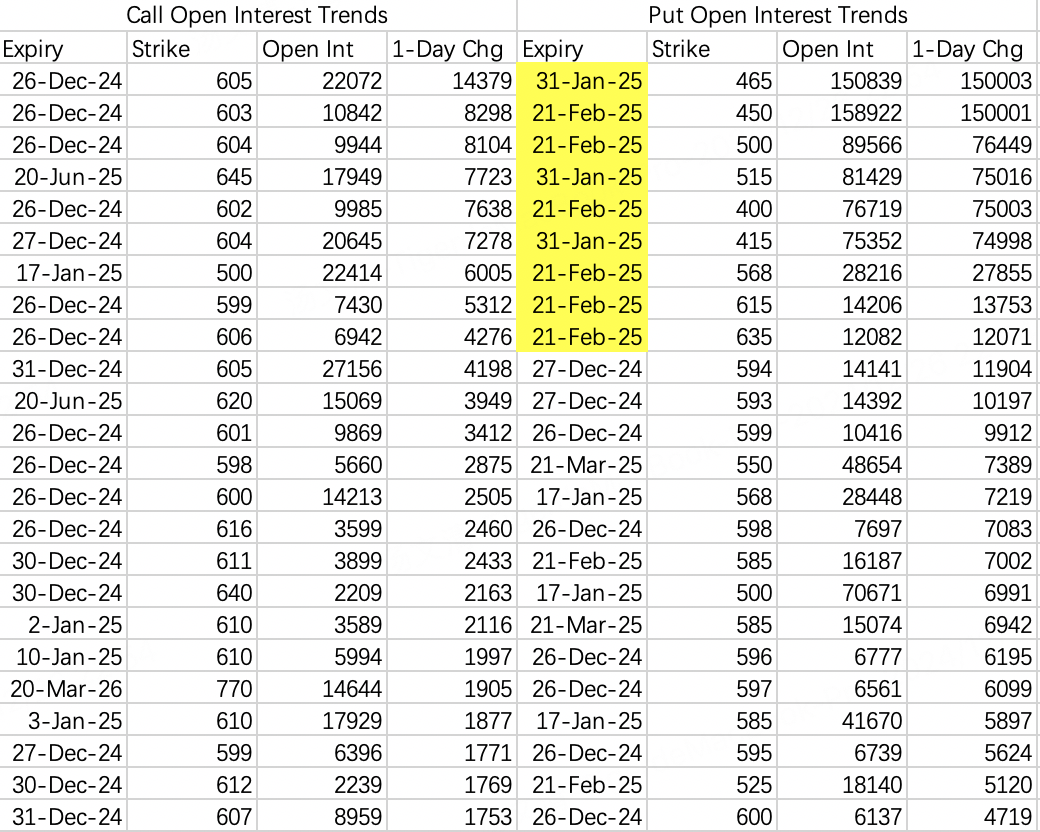
Bears are retreating step by step, with the expected crash delayed to January-February. So for now, continue with normal strategies - back to regular sell put + sell call daily tactics.
Comparing call and put options' expiry dates and strike prices, the setup is clear - expecting a correction in January-February.
Top positions show puts far exceeding calls. Top call positions focus on this week, while puts are positioned around January-February next year. The previously mentioned March 565 put large position remains open $SPY 20250321 565.0 PUT$
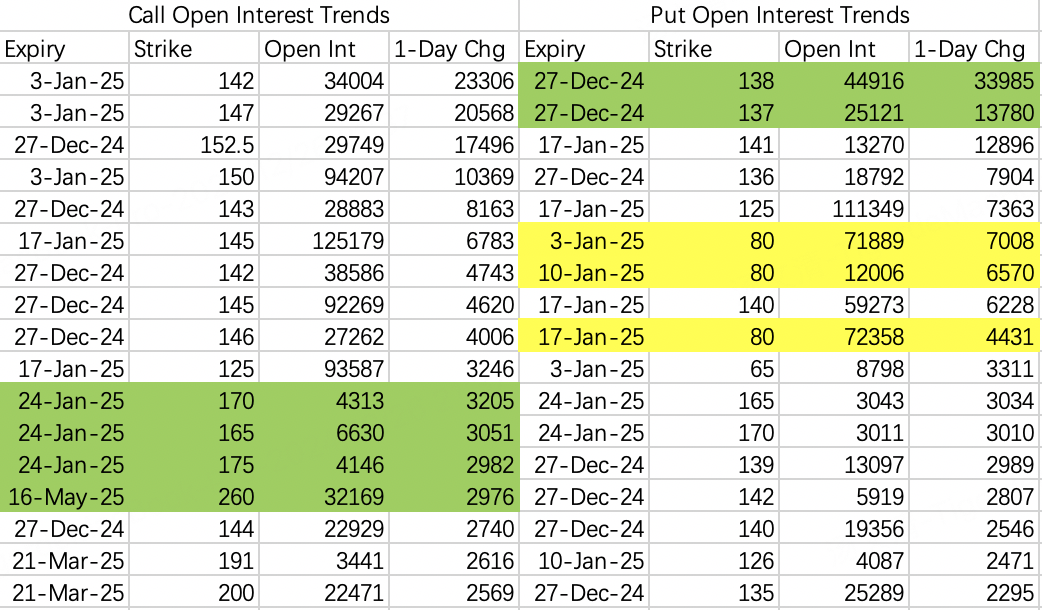
For NVIDIA, the CES electronics show starts January 8th, with some bullish options positioning, though not extensive. Instead, there are some speculative put positions.
Someone bought 80 puts for January 3rd, 10th, and 17th - I'd call this low-cost bearish speculation. Their thinking might be that with bulls so strong and shorts likely to get squeezed, the longer it doesn't fall, the bigger the eventual drop might be. So why not buy some quarterly out-of-money options weekly to bet on volatility, since it's not much money anyway.
The reluctance to make major bearish bets indicates low probability of near-term decline, so normal trading can continue.
Let's discuss $NVDA 20241227 137.0 PUT$ and $NVDA 20241227 138.0 PUT$
These are very typical examples. As I've mentioned before, focus on option type first, buy/sell direction secondary.
Most trades for these puts were sells, likely betting on time decay after NVIDIA's decent performance Monday and Tuesday and many call positions opening. However, they weren't conservative enough, sharing the same problem as the sell call institutions - strike prices too close to stock price had reverse effects, with opening price shifting toward 138 today.
Once they cut losses today, the price should rebound.
The sell call institution rolled to 142-147, suggesting forced liquidation:
Sell $NVDA 20250103 142.0 CALL$
Buy $NVDA 20250103 147.0 CALL$
The only bearish position to watch is the single-leg January 141 put: $NVDA 20250117 141.0 PUT$ with 12,000 contracts. January's most dangerous period could be from Trump's inauguration to late January FOMC meeting - plenty of excuses for a crash.
I continue holding stock + sell 135 put + sell 150 call.
The low-cost bearish speculation pattern matches NVIDIA exactly.
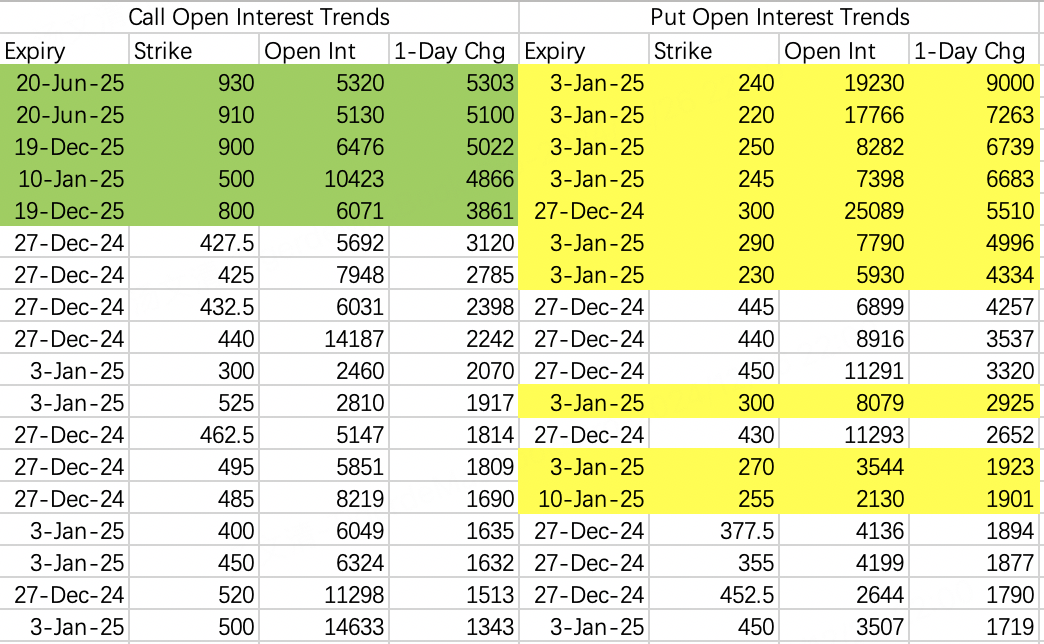
Recent Tesla options positions are hard to analyze, with both bullish and bearish positions seeming extreme, offering little reference value. But this suggests bears are helpless with Tesla, reducing short costs by buying weekly put lottery tickets around 200 strike.
Since bears aren't seriously shorting, I closed my Tesla puts and switched to sell put 400 $TSLA 20250103 400.0 PUT$
I'm not afraid to take positions - this year's first politically correct concept stock. The call option strike prices aren't that extreme when you consider Musk's birthday rally on June 28th and Independence Day rally on July 4th.
$Palantir Technologies Inc.(PLTR)$
Adding Palantir as a regular coverage - PLTR options have excellent liquidity, second only to Tesla and NVIDIA, making it easier to track.
Recent large orders show institutional call position rolling, strike price 80 expiring February 21
$PLTR 20250221 80.0 CALL$
This week's institutional bull spread strategy is sell 83 buy 88:
Sell $PLTR 20241227 83.0 CALL$
Buy $PLTR 20241227 88.0 CALL$
Common Questions Answered:
Why do the buy/sell directions sometimes differ from the images?
Program-determined directions are based on transaction price position between bid and ask. But with various order types, especially floor trades, price deviation doesn't always accurately reflect direction.How to identify floor trading large orders?
Options liquidity is much lower than stocks, so 10,000+ contracts trading at once (shown as one line) likely indicates floor trading.Are large order screenings useless if direction is wrong?
Direction is supplementary - calls are calls, puts are puts. More call positions indicate bullish sentiment, more puts indicate bearish. Expiry dates and strike prices are also crucial clues.


Comments