The market crashed just minutes after I posted an article titled "End-of-Month Pullback" on Friday. I thought, well, this isn't going according to plan. Since it happened ahead of schedule, I suppose everyone's biggest concern now is at what level it's safe to buy the dip, or whether we should be hedging right now.
I'm currently holding a 50% long position myself, because, as mentioned in the article, I wanted to keep some cash ready for buying opportunities. But I wasn't fully prepared for this crash either, even though I wrote before the National Day holiday about large VIX orders betting on a sharp drop $VIX 20251119 32.0 CALL$ . That's because the bearish sentiment has been present since July, but it kept getting squeezed out by the bulls.
Let's get to the conclusion first: although the VIX's rise is less pronounced than in April, judging from the specifics of the short positioning, the market's decline slightly exceeded bearish expectations. Therefore, while this dip is very much worth buying, we need to observe carefully before pulling the trigger.
Since Friday's options data won't be released until pre-market Monday, this analysis uses the options open interest data from Wednesday and Thursday. It shouldn't significantly impact the analysis, but it's mainly to see how the bears anticipated this pullback.
$SPDR S&P 500 ETF Trust(SPY)$
The options open interest shows that the bears positioned for this decline very early, with very structured strike prices.
The October 8th open interest data showed some expiry day single-leg puts, which are relatively rare in daily open interest data – out-of-the-money, one-directional expiry day buying. Some legs even expired worthless, like the 659put and 664put expiring on the 9th.
But the October 10th expiry $SPY 20251010 659.0 PUT$ and the October 13th expiry 651put $SPY 20251013 651.0 PUT$ both hit.
Here's the key point: the strike prices chosen by the bears in their open interest are very informative, especially the out-of-the-money expiry day puts, which require extremely precise timing to be profitable. However, SPY closed at 653 on Friday, far exceeding the expected 659. Looking at the timing, there might have been some slippage due to exercise-related factors, but we also can't rule out the possibility that this decline might exceed general bearish expectations.

For SPY, the general bearish expectation was a pullback to 650, primarily targeting short-term volatility around news events using expiry day puts.
Some bears are positioning for a mid-term move, expecting a pullback to around 640, as seen in the October 9th put open interest data. A representative option is $SPY 20260116 640.0 PUT$ . These bears typically buy options expiring in November or later. This is understandable; this round of negotiations is likely to be protracted. While the AI fundamentals are strong, the back-and-forth haggling could certainly cause the market to retest lows.

Then there's the scenario I least want to see, though it might delight those holding the most cash: a SPY pullback to 600. Representatives are this put spread expiring in late November: $SPY 20251128 600.0 PUT$ $SPY 20251128 500.0 PUT$ , along with other put hedging combinations below 600.
While it's hard to imagine SPY falling below 600 in this round, as the saying goes, the probability is not zero.
So, what's my take?
On Friday, I thought 650 was the most likely stopping point. But since Friday's drop exceeded expectations, I now think a move to 640 is quite possible.
And while I don't want to see 600, the uncontrollable factors in this round of negotiations aren't necessarily fewer than the last round. There might be some fundamental issues where compromise is impossible. Again, the probability of 600 is not zero.
Considering Trump's performative personality, the safest approach, if you don't mind missing the absolute bottom, is to wait for him to stand up and announce the bull market is back before going long.
Overall, 650 corresponds to a 3% drop, 640 to 5%, and 600 to 10%.
I have a very subjective, conspiratorial view: I can't help but suspect this crash happened because Trump missed the boat on the September AI rally. What level does 650 correspond to? Right before Oracle's massive surge two days prior! When Trump can buy Oracle at 250, AMD at 170, the market might have bottomed. Let's hope that doesn't happen, though.
$NVIDIA(NVDA)$
If you told me two weeks ago Nvidia would hit 165, I'd think the market had gone crazy. But now there's a probability it materializes.
Looking at the October 8th put open interest: the top opening was the 155put expiring Oct 17 $NVDA 20251017 155.0 PUT$ , with 9,573 contracts opened; second was the 165put expiring Nov 21 $NVDA 20251121 165.0 PUT$ , with 5,505 contracts opened.
If the pullback hadn't happened, these would just act as hedges. But now that it has happened, the strike prices become target prices.

Looking at the puts opened on the 9th, there's a bearish strategy using the 180-160 puts expiring Nov 7 $NVDA 20251107 180.0 PUT$ $NVDA 20251107 160.0 PUT$ , also corresponding to an expectation of falling below 180.
The issue is, if this SPY pullback stops at 650, Nvidia will likely just oscillate around 180 at most. But the October 9th put open interest data lacks significant open interest in the 180~170 range upfront; it's more concentrated at 190 and 160. So, judging from NVDA, if NVDA breaks below 190, the probability of a SPY pullback to 640 increases.

There's also expectation for NVDA to pull back to 150, which isn't insignificant, corresponding to a SPY pullback to 600. Theoretically, one could buy 150puts on stock bounces for hedging, but such extreme moves might only present a window of about three days. Nvidia at 150 sounds terrifying but is also very compelling to buy, which means such a decline wouldn't last long.
So, what really needs attention is: if SPY indeed hits 640, or even 650 next week, it might be time to buy the dip across the board. But don't use leverage; be wary of potential subsequent extreme moves causing margin calls.
$Tesla Motors(TSLA)$
Tesla is extreme: either 400 or 300. Actually, in Friday's drop, many stocks looked like they were nearing their pullback targets, but the broader market hadn't finished falling – that's the scary part.

$Advanced Micro Devices(AMD)$
Most put open interest is still concentrated around 200, with some below 200, down to 170. If it really pulls back to 170, go all in buying the dip.

$Intel(INTC)$
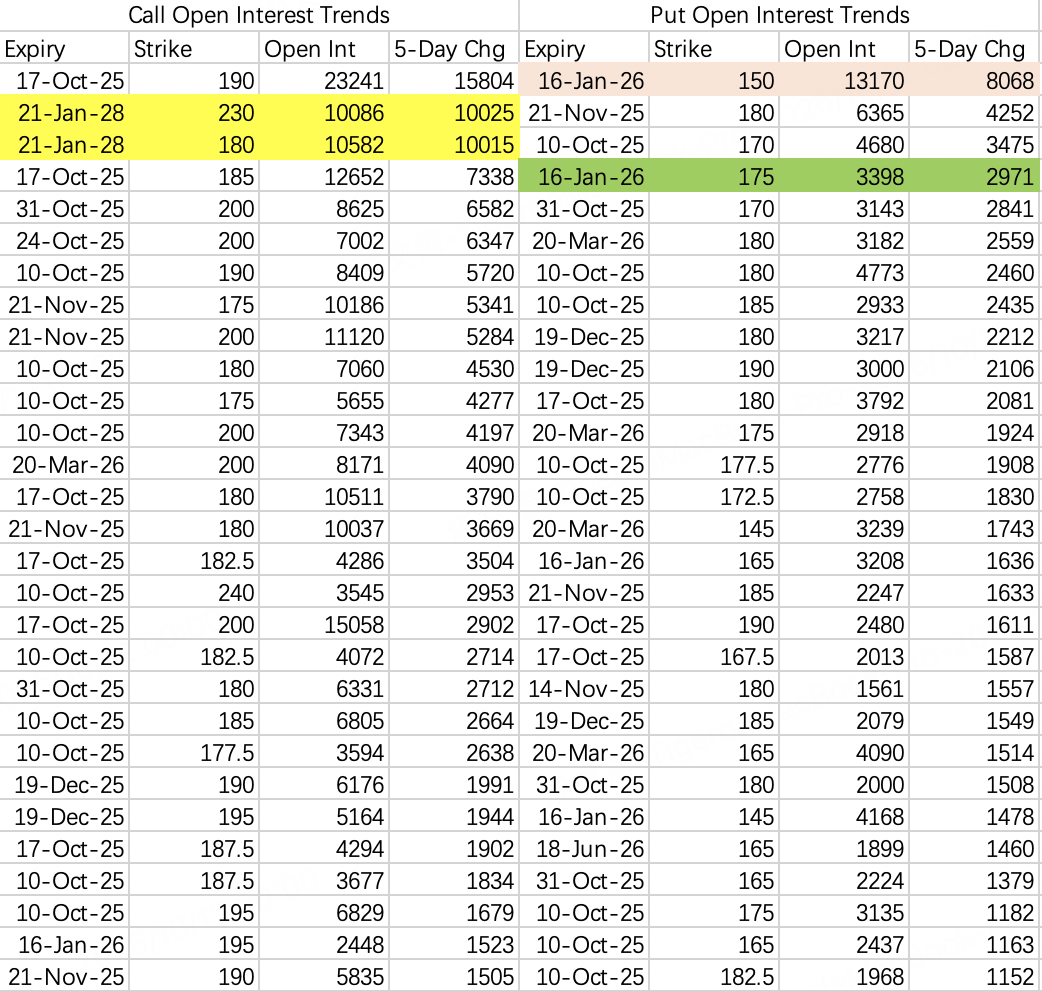
I've placed the Oct 9th open interest data below, but there's a simpler, more unconventional way to think about the pullback:
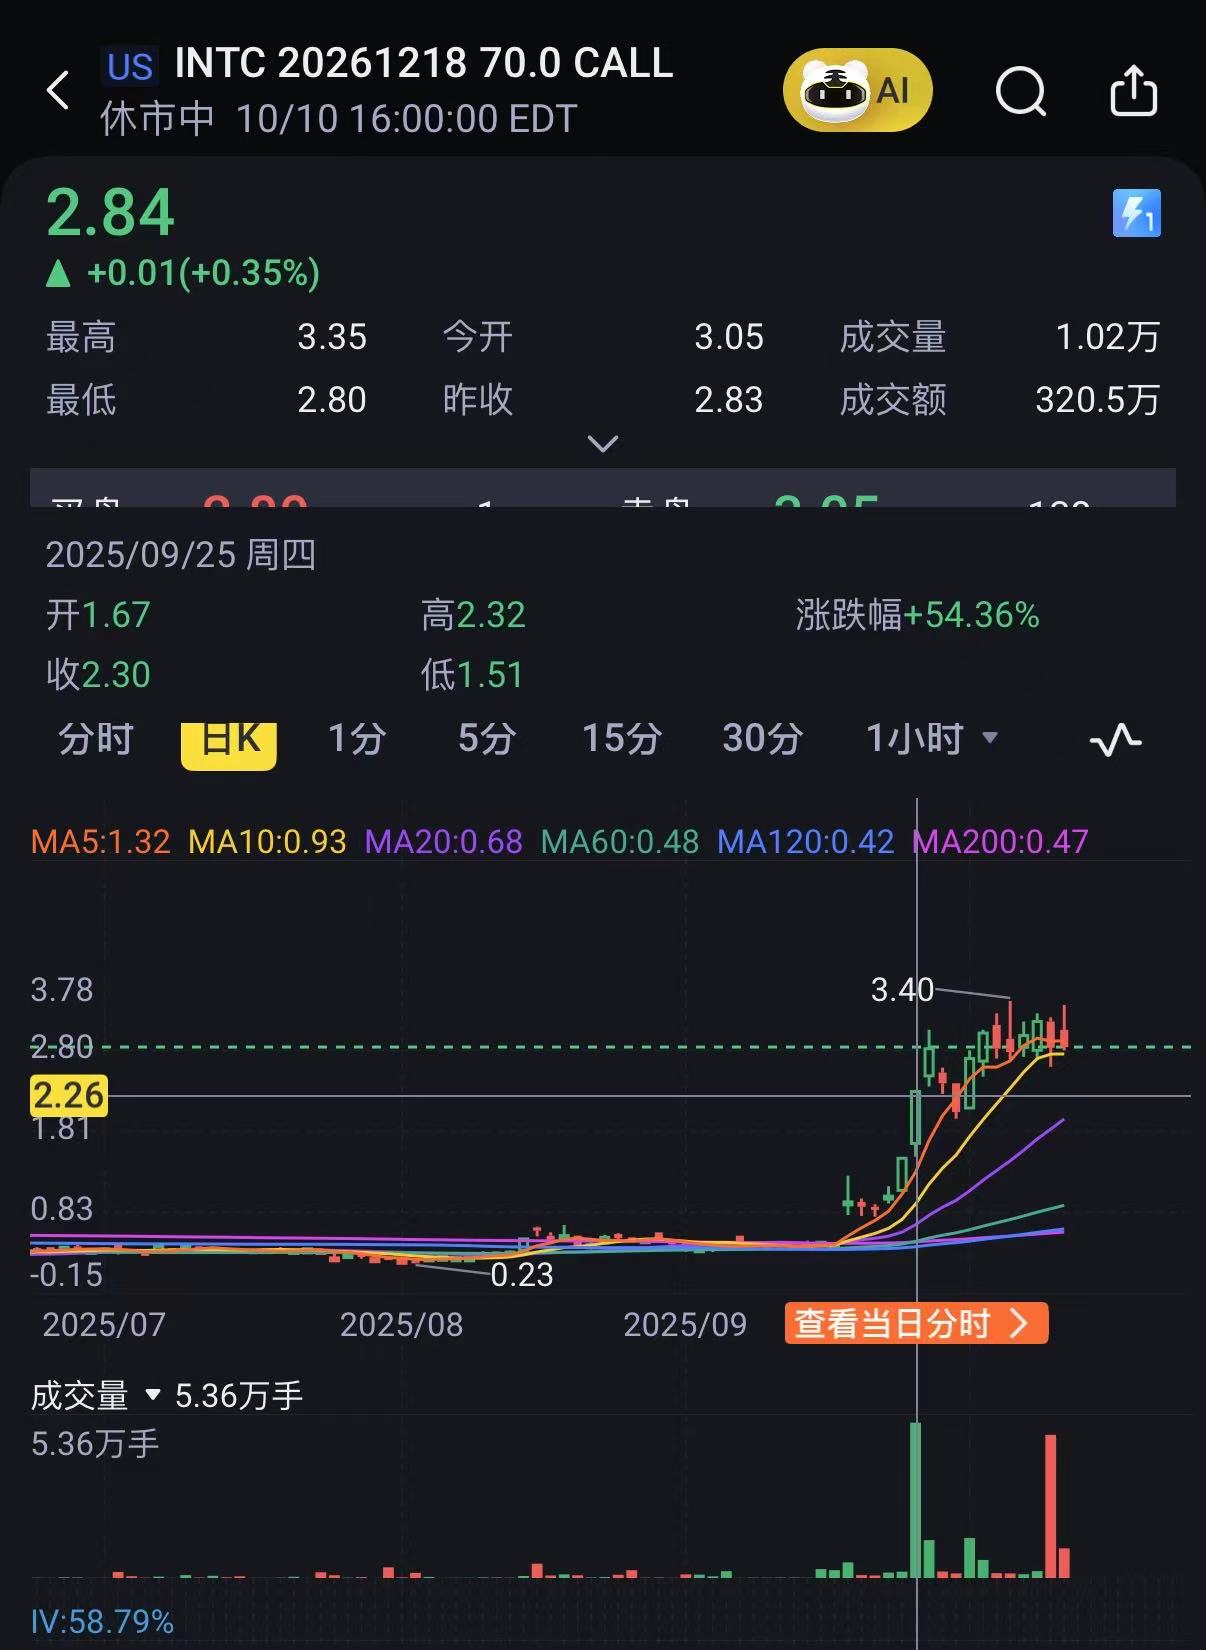
On Thursday, a super long-dated, deep out-of-the-money call – the 70call expiring Dec 18, 2026 $INTC 20261218 70.0 CALL$ – was closed out, with 28,000 contracts liquidated. Doing this a day early... hints at potential insider knowledge.
As everyone knows, out-of-the-money options fear volatility and time decay, even long-dated ones. The delta for this 70call is 0.269, within the range sellers consider for potential assignment.
This large position was opened on September 25th. What was Intel's stock price on September 25th? 31.6 ~ 34. The closing price on Thursday was around 37.5.
This implies the large position expects the pullback to go below the stock price when the position was opened. So, this pullback might go down to 31, near the 20-day moving average.

$Apple(AAPL)$
If you sort Apple's put open interest by 5-day increase, you'll find someone previously bought the 250put expiring Nov 21 and the 250put expiring Mar 20, 2026: $AAPL 20251121 250.0 PUT$ $AAPL 20260320 250.0 PUT$ , which are currently profitable. I expect the Nov expiry put might be rolled over on Monday or Tuesday.
At-the-money puts don't require a large drop, so expect some support around 245. Ultimately, it depends on SPY.

$Alibaba(BABA)$
There isn't much bearish info on Alibaba; it's been heavily bullish. Without this pullback, it would likely have kept oscillating at high levels between 170~190.
The options market for Chinese ADRs seems less mature; the market wasn't prepared for deep hedging and got caught off guard. Looking at 150~140 for now.
$CoreWeave, Inc.(CRWV)$
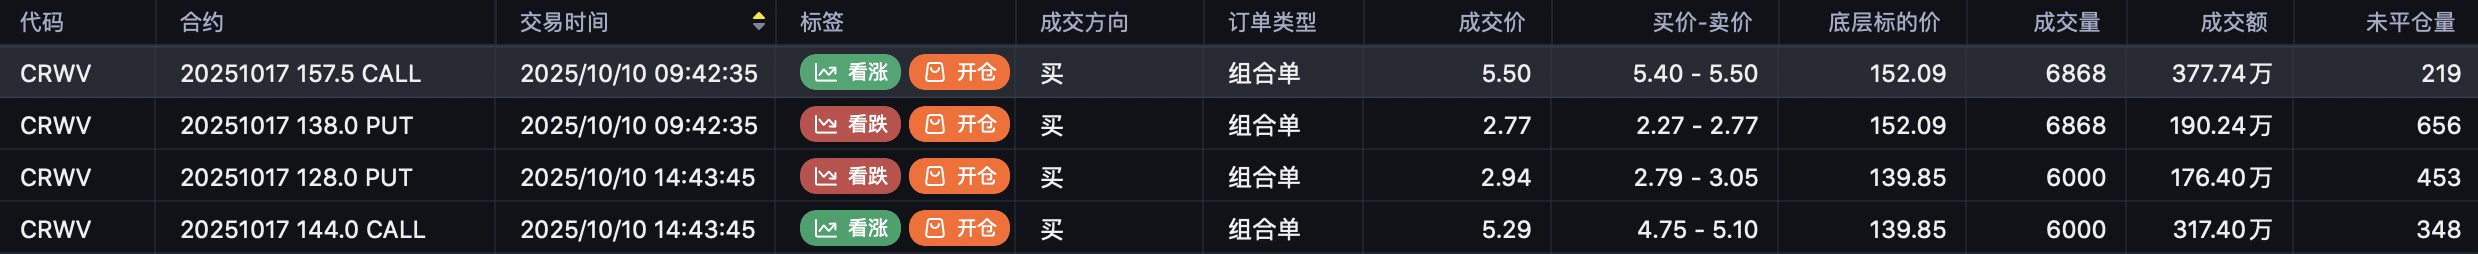
The action in CRWV is straightforward: Institutions opened the 157.5call and 138put $CRWV 20251017 157.5 PUT$ $CRWV 20251017 138.0 PUT$ at Friday's peak. Then, after it dropped to 138, expecting further decline next week, they opened the 144call and 128put $CRWV 20251017 144.0 PUT$ $CRWV 20251017 128.0 PUT$ .
This suggests CRWV could drop to 128 during the week of Oct 17th. If institutions haven't opened new positions by then, it might be time to buy the dip.
Comments