It's not a popular topic to bring up during bullish times, but this series of large orders is just too outrageous.
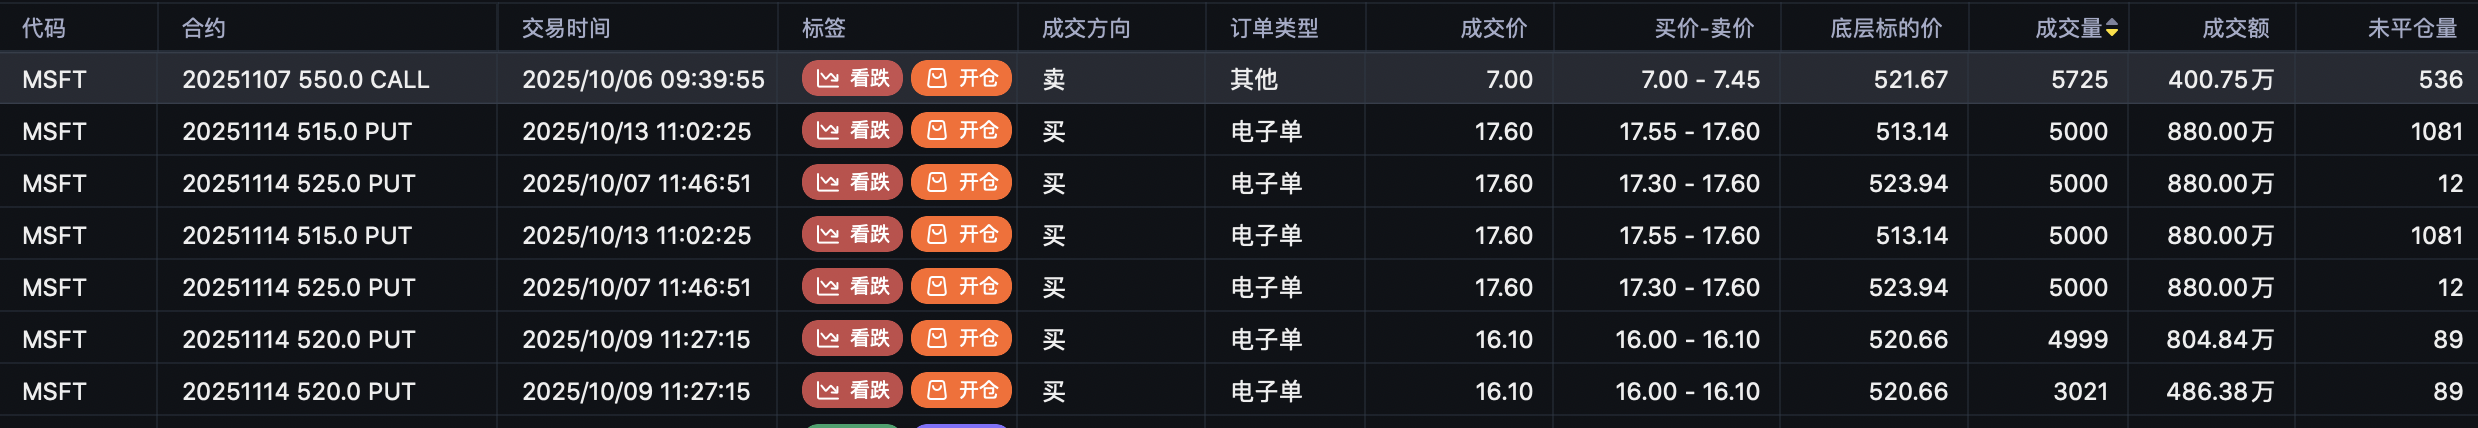
A few days ago, someone purchased nearly $60 million worth of put options, all expiring on November 14th, with strike prices of 515 $MSFT 20251114 515.0 PUT$ , 520 $MSFT 20251114 520.0 PUT$ , and 525.
Specifically, the 525 $MSFT 20251114 525.0 PUT$ was a 10,000 contract order placed on October 7th; the 520 was a 12,700 contract order placed on October 9th; and the 515 was a large 17,000 contract order placed on October 13th. The total notional value is around $60+ million.
The outrageous parts are the huge size, the near-term expiration, and the consecutive buying. Let's be clear, $60 million is no small sum, even among large block trades. If MSFT doesn't drop this week or next, that $60 million will be wiped out.
My advice remains the same as before: reduce leverage, hold cash, implement collar protection on long stock positions, and consider appropriate short positions.
It's worth watching today's open to see if there are any new put openings. Overall, the current situation is pretty clear.
Additionally, referencing a large sell call order from the October 6th high: $MSFT 20251107 550.0 CALL$ . This large order can also be used for reference now.
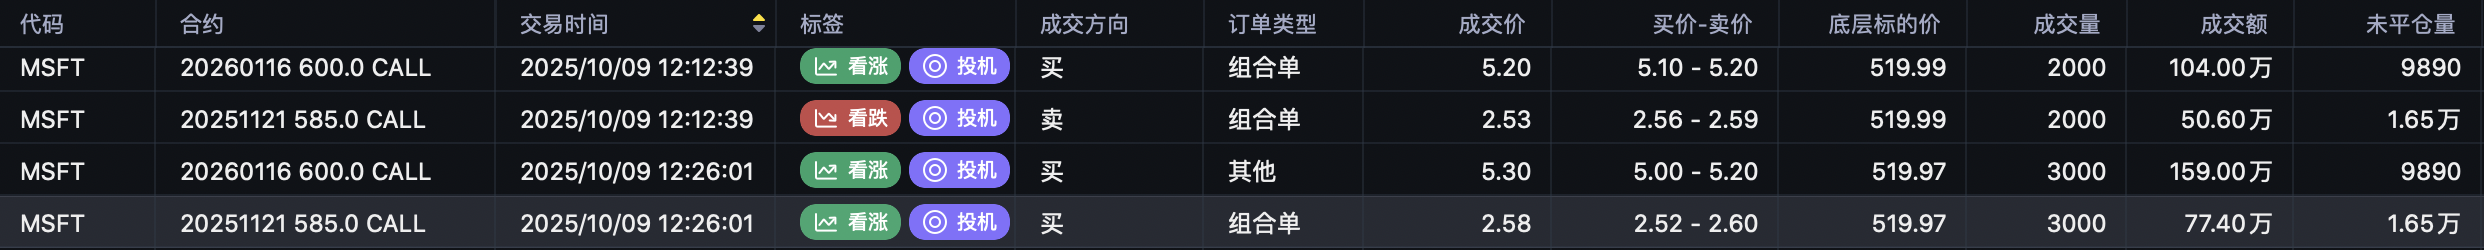
Another development: long call rolls, from the November 585 call $MSFT 20251121 585.0 CALL$ to the January 600 call $MSFT 20260116 600.0 CALL$ .
This also indicates something: bulls believe it's difficult for the earnings season to deliver a 15%+ rally, hence the extension to January. The higher strike price suggests bulls think Microsoft's stock price elasticity has recovered well post-negotiations.
The stock price is expected to struggle to break above 190 before November 7th. Institutional spread strategy involves selling the 190 $NVDA 20251107 190.0 CALL$ and buying the 200 $NVDA 20251107 200.0 CALL$ .
This week's bearish put spread involves selling the 170 $NVDA 20251017 170.0 PUT$ and buying the 167.5 $NVDA 20251017 167.5 PUT$ . In short, it looks like the pullback will continue this week.
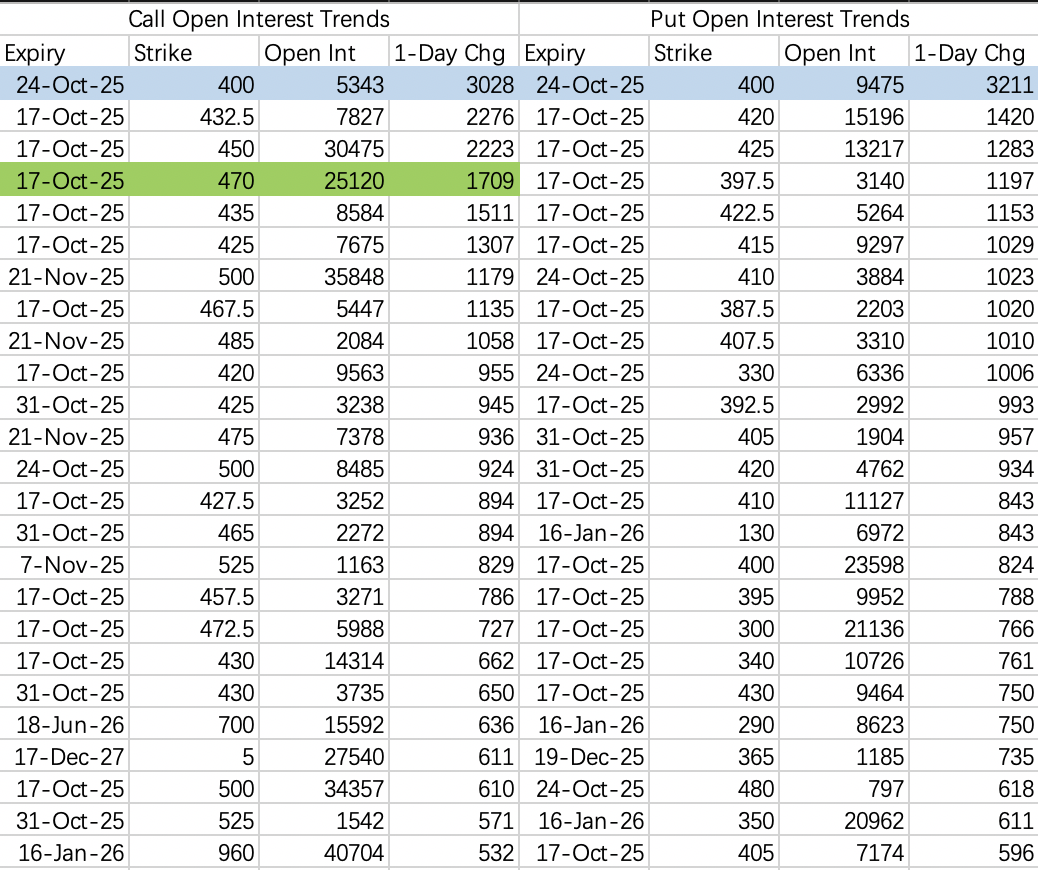
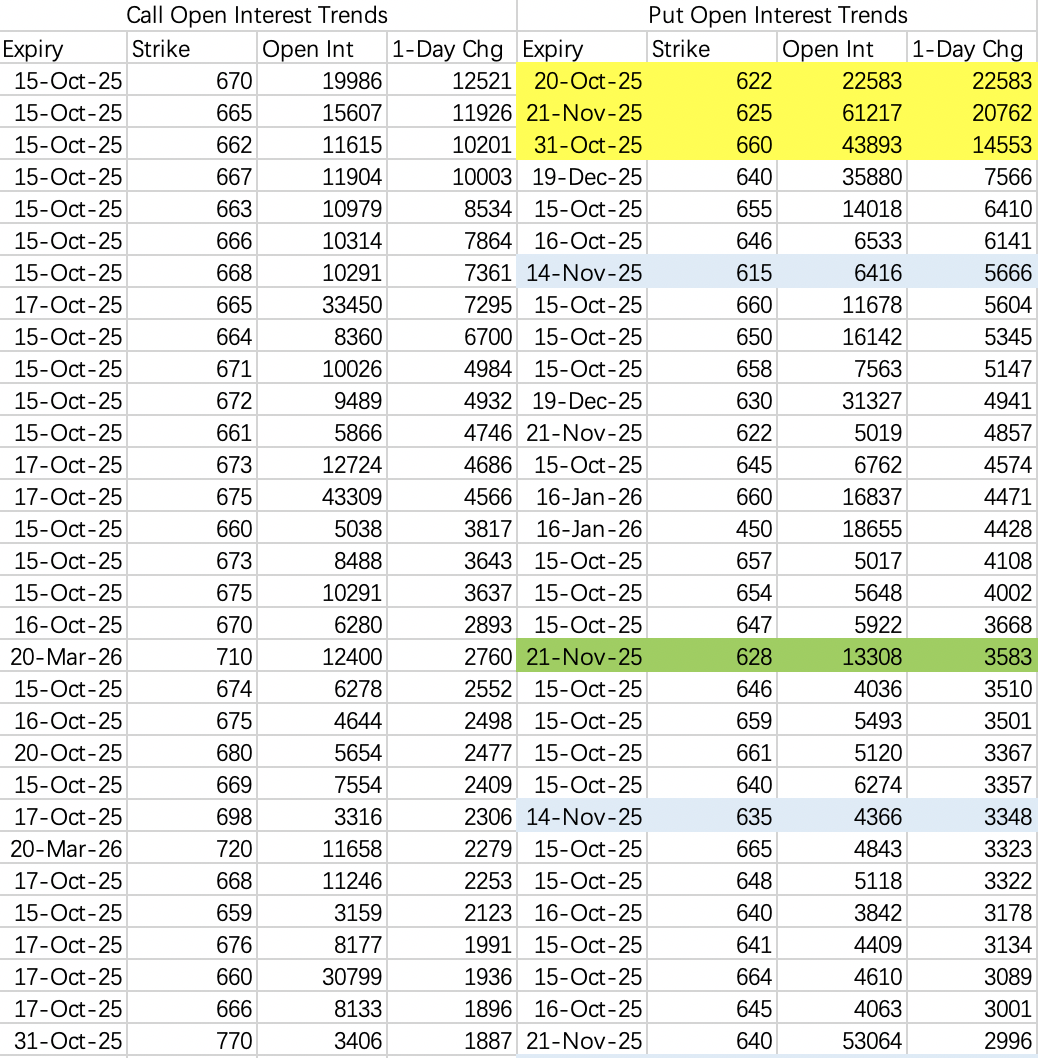
Bearish opening isn't very aggressive. Based on the open interest, the trading range seems to be 400~450, which is almost unbelievably calm. Perhaps the shorts are all focusing on chip stocks instead.
Notable put openings: $SPY 20251020 622.0 PUT$ $SPY 20251121 625.0 PUT$ $SPY 20251031 660.0 PUT$
If a black swan event is going to happen, the timeline points to the next couple of weeks.
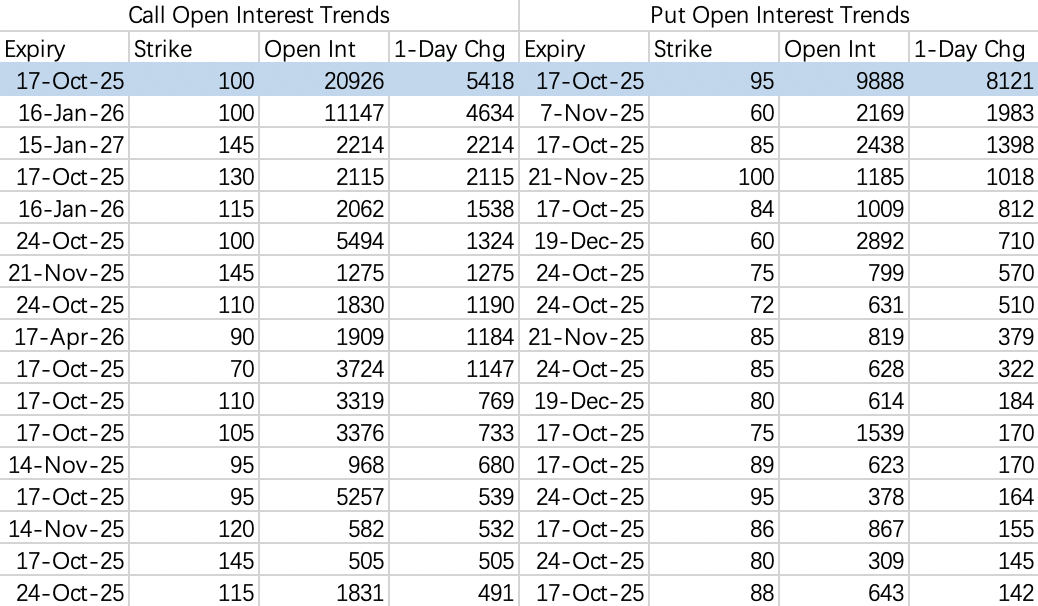
MP will likely struggle to surpass 100 this week. Institutional open interest shows key strikes at the 100 call and 95 put $MP 20251017 95.0 PUT$ $MP 20251017 100.0 CALL$ . For implementation, refer to the previously discussed CRWV strategy. If the stock price approaches the put strike, consider selling puts. Reaching the call strike requires careful assessment; generally avoid selling calls unless you hold the underlying stock.
Also note, institutions were caught in a short squeeze yesterday and performed a roll. Their strategy before the roll involved the 80 put and 86 call.
$Taiwan Semiconductor Manufacturing(TSM)$
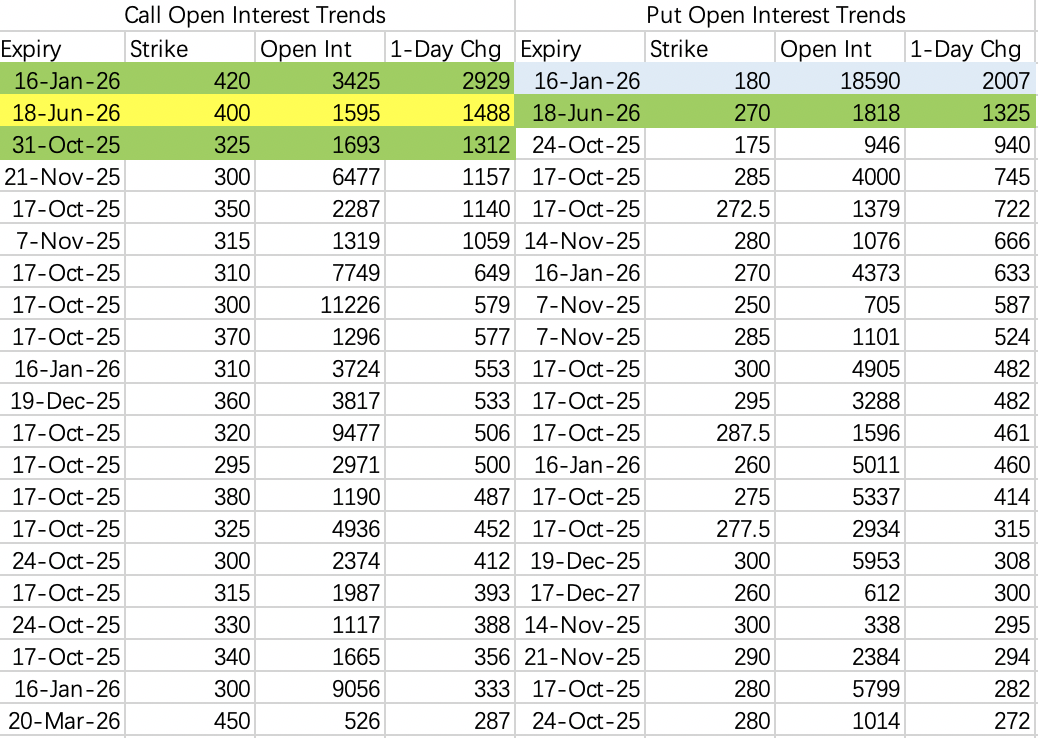
Perhaps because the price direction post-earnings is hard to call, the open interest data isn't abundant. Generally, it seems biased towards staying below 325 $TSM 20251031 325.0 CALL$ . If considering a short volatility play, it's advisable to add a long call leg for protection.
The bearish expectation seems to be staying above 270 $TSM 20260618 270.0 PUT$ , although the stock price will almost certainly be above 270 by June 2026.
Also, there's a black swan put position at the 180 put $TSM 20260116 180.0 PUT$ , which saw volume of 9,555 contracts back on October 6th.
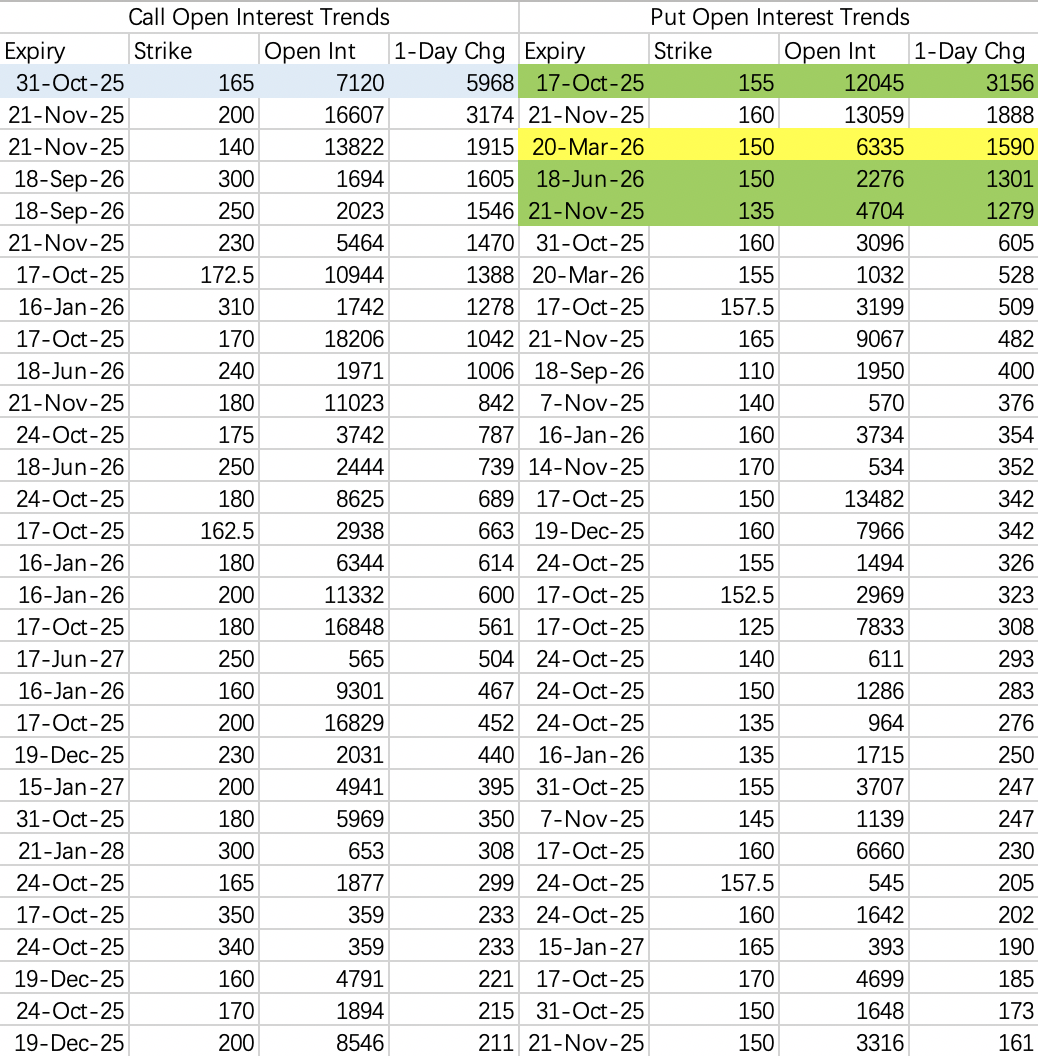
Most bearish put positioning is structured around the 150 level, e.g., $BABA 20251017 155.0 PUT$ $BABA 20260618 150.0 PUT$ . This indicates the market is relatively bullish on Alibaba.
Comments