Core divergences
Foreign Capital Flows: Goldman Sachs believes foreign capital (especially from Europe) will continue to flow; UBS warns of a possible return of capital to local markets.
Rally Sustainability: Morgan Stanley is short-term bullish based on technicals; JPM emphasizes that weak fundamentals will limit the room for a rally.
Economic cycle positioning: Deutsche Bank historical data suggests that the current pullback or non-bear market precursor; JPM believes that the risk of stagflation is more similar to a structural crisis.
Goldman Sachs: Foreign Capital Supports U.S. Stocks, Long-Term Growth Logic Unchanged $Goldman Sachs(GS)$
Core view: foreign capital (especially European investors) will continue to add to U.S. stocks and drive the market.
Argument support:
Liquidity advantage: the U.S. equity market is significantly more liquid than non-U.S. markets, attracting global capital.
Strong growth expectations: S&P 500 EPS growth is expected to be 7% in 2025-2026, well ahead of Europe (4% in 2025 and 6% in 2026).
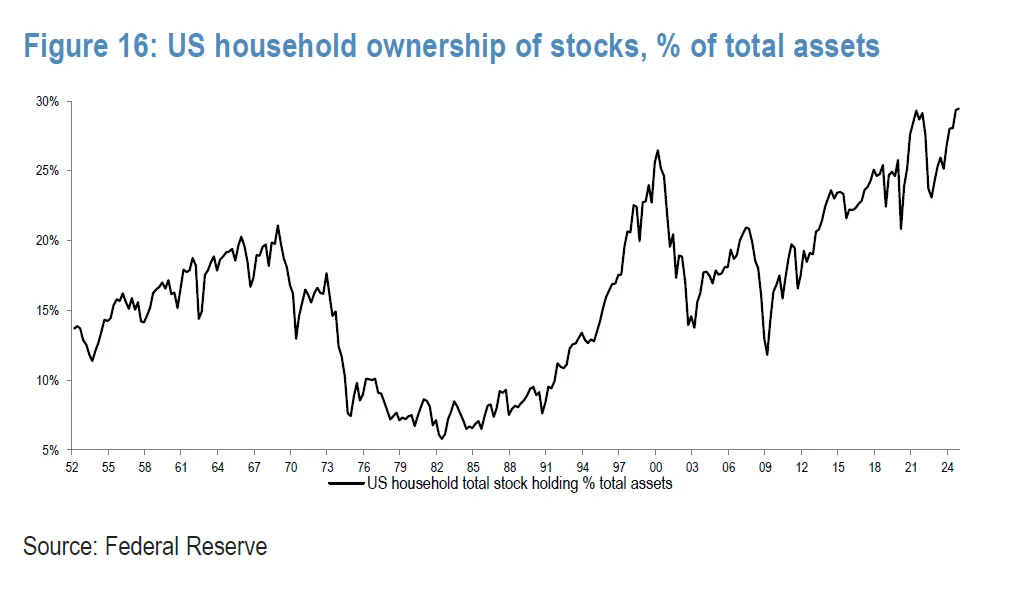
Rising foreign ownership: foreign ownership has risen from 2% in 1960 to 18% in 2025, with European investors contributing nearly half of demand.
Risk Tip:
US economic policy uncertainty (e.g. guan tax, Trump policies).
Slowing domestic growth and weaker-than-expected returns from AI technology.
UBS (UBS): U.S. exceptionalism challenged, wary of foreign exit pressure $UBS Group AG(UBS)$
Core concern: U.S. asset overweight may face unwinding risk, the dollar may be sold off.
Logic Chain:
Weakening Growth Advantage: China's tech competition, U.S. fiscal austerity, and European security policy forces are weakening the relative attractiveness of the U.S.
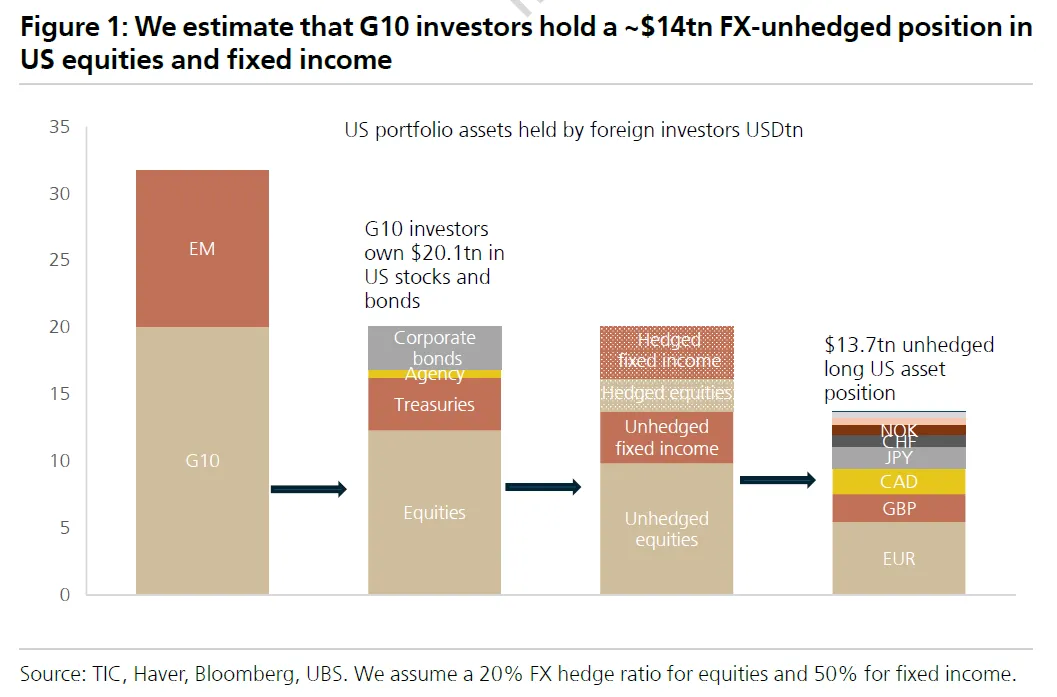
Position structure vulnerability: foreign investors hold $13.7 trillion in US equity market capitalization (G-10 net unhedged exposure), a 5% reduction would trigger a $700 billion sell-off.
Market sensitivity: Private investor-led positions in US equities are more risk-sensitive and could accelerate capital flows back to Europe.
Deutsche Bank: Historical pullback statistics reveal market resilience $Deutsche Bank AG(DB)$
Data Conclusion:
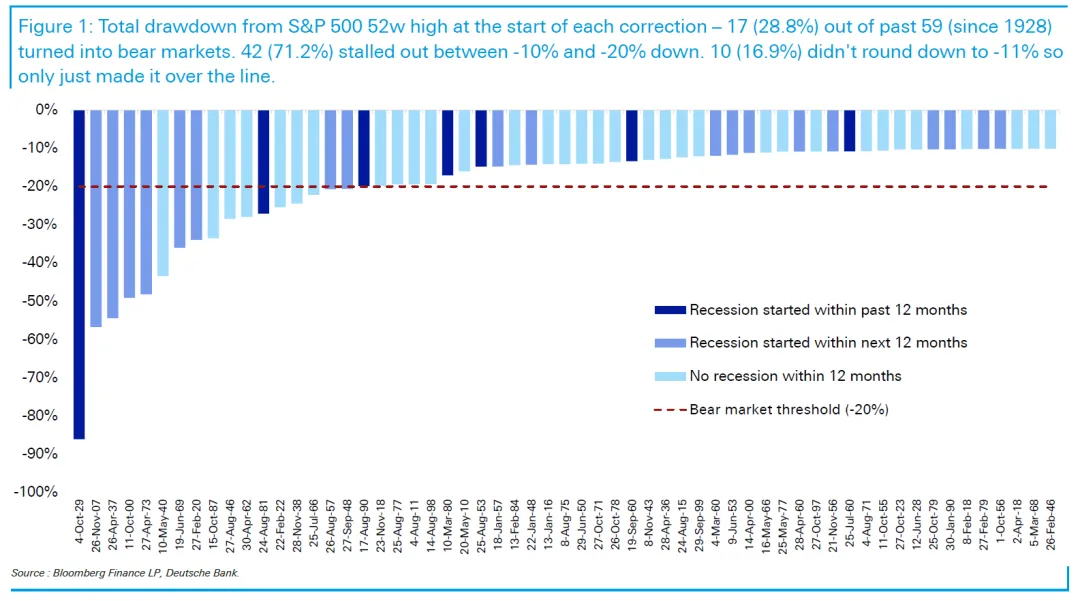
Since 1928, the S&P 500 has experienced 60 pullbacks (declines of more than 10%), with only 28.8% evolving into bear markets (declines of more than 20%) and 71.2% stopping in the 10%-20% range.
16.9% of the retracements did not fall more than 10.5%.
Recession correlation: some of the pullbacks were recession-related, but most did not deteriorate to a bear market.
Morgan Stanley: technical rally can be expected, stabilization in leading stocks is key $Morgan Stanley(MS)$
Short-term bearish logic:
Seasonality: month-end/quarter-end flows support rally.
Sentiment Repair: Oversold indicators (e.g., lower USD/US bond yields) provide short-term support, and the S&P may rally to 5,500.
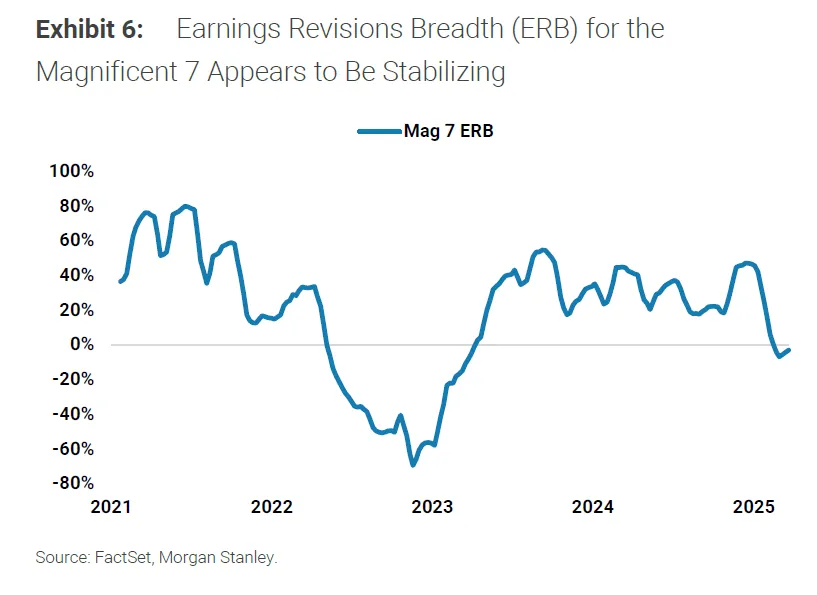
Earnings stabilization signals: The "Big 7" earnings revisions are stabilizing, which may prevent the market from falling further.
Capital rotation: If leading stocks stabilize, international capital may flow back to U.S. stocks.
JPMorgan Chase (JPM): stagflation risk weighs on rally sustainability $JPMorgan Chase(JPM)$
Cautious view:
Nature of the rebound: currently only a technical fix after oversold, lack of fundamental support.
Cyclical differences: unlike the 2017 disinflationary environment, the current stagflation risk (PMI volatility, labor market weakness).
Policy risk: fiscal/monetary policy uncertainty exacerbates market volatility.
$S&P 500(.SPX)$ $NASDAQ(.IXIC)$ $Invesco QQQ(QQQ)$ $Dow Jones(.DJI)$ $Cboe Volatility Index(VIX)$ $SPDR S&P 500 ETF Trust(SPY)$ $ProShares UltraPro Short QQQ(SQQQ)$ $ProShares UltraPro QQQ(TQQQ)$ $SPDR S&P 500 ETF Trust(SPY)$
Comments