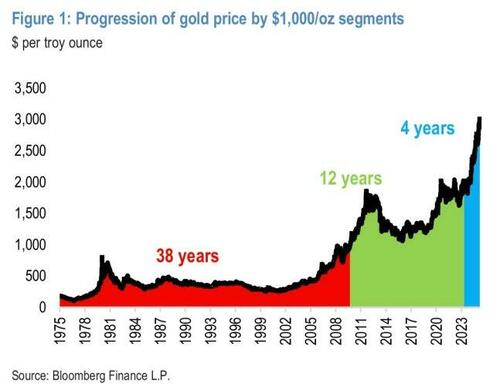
In its report, JPMorgan noted that the time it takes for gold to break through the $1,000 round number each time has shortened exponentially:
$1,000 (2008): 38 years
2000 (2020): reduced to 12 years
$3000 (March 2025): just under 5 years
Following this pattern, $4,000 could take only a third of the time of the previous period (5 years), i.e. about 1.5-2 years, corresponding to mid-late 2026 .
$SPDR Gold ETF (GLD)$ $ S&P 500 (.SPX)$
Key Drivers
Central bank gold purchases and the dollar credit crisis
Global central banks continue to increase their gold holdings at a rate of 80-109 tons per month (2022-2025 data), well above historical averages, and with IMF data showing the share of US dollar reserves falling to 57.4% in Q3 2024, gold is becoming a core asset for hedging US dollar credit risk.A "non-linear upside" could be triggered by an escalation of the US debt crisis (currently $38 trillion) or geopolitical conflict.
Fed policy and recession risk
Goldman Sachs expects the Fed to cut rates three times (totaling 75 bps) in 2025, and lower real rates will lower the opportunity cost of holding gold.If the recession probability (currently 45%) becomes a reality, gold ETF inflows could accelerate, pushing prices above $3,880 by the end of 2025 and further towards $4,000.
Geopolitics and market liquidity
The U.S.-China trade war and semiconductor tariff hikes (April 2025 Trump statement) continue to fuel safe-haven demand.Meanwhile, gold market liquidity is tightening due to mine supply constraints and solidifying ETF positions, which could amplify price volatility
Comments
Its probable if markets continue to whipsaw.