The market is currently at a turning point, and a reversal in U.S. equities may be imminent.
Last weekend, the unexpected downgrade of the U.S. credit rating by Moody’s put significant pressure on the markets. However, looking at the crypto markets—which remained open over the weekend—there was only limited panic. Clear divisions between bulls and bears persist, with pronounced roller-coaster swings during trading. The gradual return of volatility is generally negative for risk assets, but whether this marks the end of the current rebound remains uncertain; another catalyst may be required to drive the next significant move.
In fact, changes in market dynamics have already appeared in the gold market. In the latter part of last week, gold twice tested support near 3,100 before stabilizing, suggesting that after a double-digit correction, gold is once again in contention. Chart patterns seem to show a large double top, but as emphasized weeks ago, gold’s major historical tops on the monthly or quarterly charts have never been singular peaks; there is likely at least one more upward move to retest previous highs.
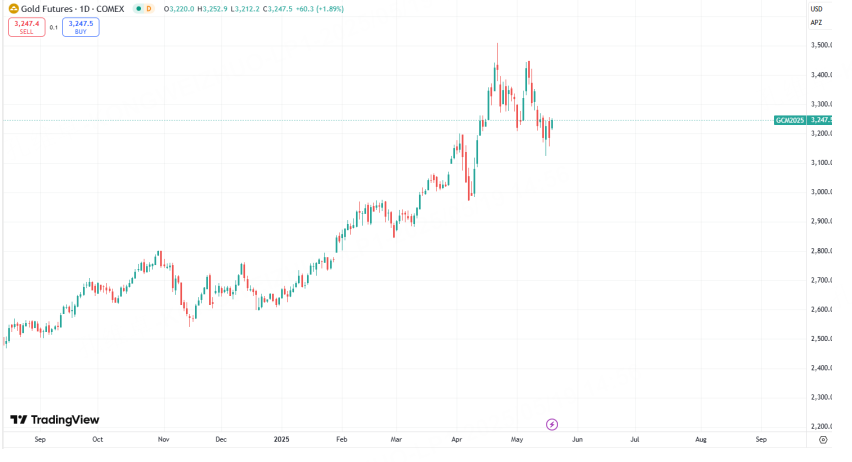
So far this year, gold—as a safe-haven asset—has shown obvious negative correlation with equities, cryptocurrencies, and other risk assets. If gold continues to rebound and strengthen, it is highly probable that other asset classes will retreat. On the daily chart, the 3,260 level marks the previous breakdown point; if bulls reclaim this area, more upside could be unlocked.
Of course, the most important indicator and benchmark for markets remains the U.S. stock indices, as they represent the largest market segment. In recent weeks, the rebound in major indices has been very impressive, even sparking speculation about fresh record highs. Fundamentally, even if new highs are set, they are likely to be bull traps, but such moves would undeniably boost market sentiment. Failure to reach new highs and a return to weakness would likely trigger renewed declines across most markets.
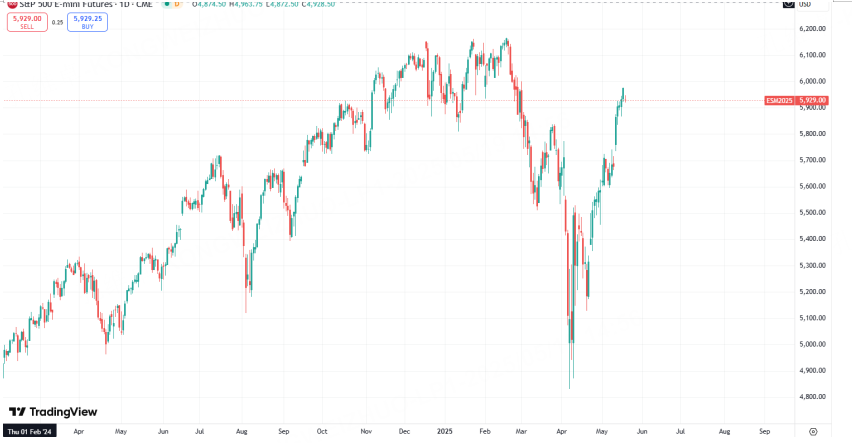
At current levels, indices are near the launching point of the prior major drop, and the tug-of-war between bulls and bears is evident. From a risk-reward perspective, selling into strength is worth considering, given there is ample room for a retreat toward previous lows. For those seeking more caution, waiting for a minor breakdown on the daily chart before joining the bears may be prudent. Alternatively, if Trump makes headline-grabbing news, this could signal the start of a new move, but such developments can only be responded to in real time, not anticipated.
Returning to last week’s focus on Ethereum, the weekly close formed a distinct large doji. Looking at past cycles, in a bull market this typically signals consolidation before further gains, while in bear market rallies or at major tops, it often marks the beginning of a decline. With neither side prevailing last week, this week is likely to produce a decisive result. A break below 2,270 would be bearish, while for the bulls, the best scenario would be a new rebound high—or at least a recovery above 2,590/2,650. Aside from last week’s modest new rebound high in Bitcoin, other factors suggest the market is more likely to end its rebound and weaken again.
Three weeks ago, we projected the rebound would finish within one to two weeks, and with the passing of time, this expectation has been met. Ending the rebound doesn’t mean an immediate steep drop, but if risk assets see significant declines (a solid bearish daily candle) this week, it would strongly support that view. On the other hand, if indices set fresh highs or other risk assets continue rebounding, this judgment would need reassessment.
$E-mini Nasdaq 100 - main 2506(NQmain)$ $E-mini S&P 500 - main 2506(ESmain)$ $E-mini Dow Jones - main 2506(YMmain)$ $Gold - main 2506(GCmain)$ $WTI Crude Oil - main 2507(CLmain)$
Comments