The following report from $Citigroup(C)$ 's Q3 Commodity Markets looks at the overall Q3 picture of short-term pressure and long-term improvement, with macroeconomics facing multiple challenges of high interest rates, tariffs, and geopolitics, but OBBBA and Trump policies could reverse the trend, with an optimistic outlook for growth in 2026.In commodity markets, gold may retreat after short-term consolidation and investors need to be cautious; energy markets are highly volatile and concerned about geopolitical risks; aluminum and copper are favored due to technology-driven structural demand; and agriculture is relatively minor.
I. Core Conclusions and Convincing Trades (Executive Summary)
Gold's 'Last Hurrah'
Status: Gold price at record high ($3,415/oz), global gold spending at 0.5% of GDP (50-year high), reflecting safe-haven demand (geo-risk + growth concerns).
Outlook: high Q3 oscillations (
$3,100-3,500/oz) but have peaked; investment demand expected to cool from H2'25 and fall back to$2,500-2,700/ozby 2026.Driving factors:
Passage of the U.S. "stimulus package bill" (OBBBA) boosts growth confidence;
Fed rate cuts to start in September 2025 (to neutral rate of 3% in 2026)
Approaching midterm elections prompting Trump's policy shift to moderation.
RECOMMENDATION: Producers hedge forward price risk (lock in $3,600-3,700/oz).
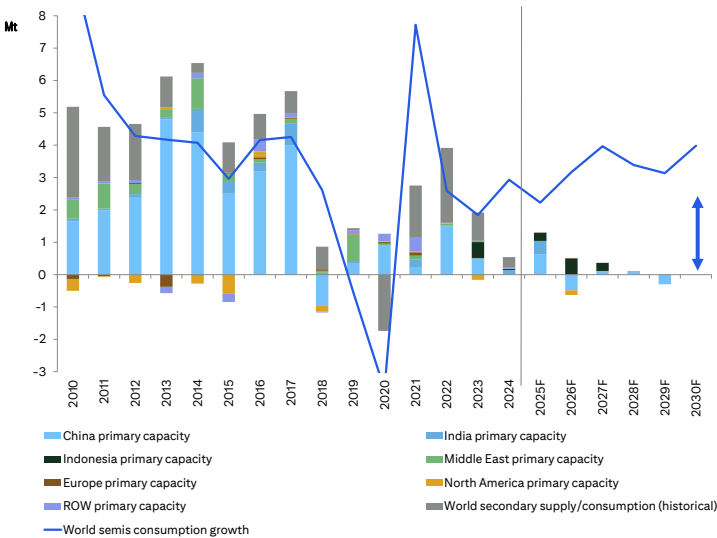
Aluminum: structurally bullish (Bullish Aluminium)
Logic:
Demand: AI data centers, robotics (single humanoid robot consumes 20-25kg of aluminum), energy transition to drive long-term growth;
Supply: China capacity capping + power constraints (competing with data centers for energy), 15-20 million tons of new supply needed by 2030;
Shortfall: current price
of 2,500/t does not incentivize enough supply, needs to rise to3,000+/t (+20%), extreme shortages could see $4,000/t.
Recommendation: Consumers to take a position on the low side (6-month gradual buy), targeting $3,000/t (+20%) by 2026.
EUA Carbon breakthrough imminent
Target: rise to €95/t by end-2025 (current price €74/t, +28%).
Catalysts:
Low wind + hydropower recovery pushing up fossil energy demand;
September compliance period approaching + auction supply contraction (MSR mechanism);
Fund positions only 17k lots (Jan high 60k lots), lots of room to rally.
Geo & Policy Risks
Iran/Israel conflict: $10-12/bbl risk premium implied in oil prices, unsustainable if not hitting Strait of Hormuz or Kharg Island exports.
US Section 232 tariffs:
Copper: high probability of 25% tariff (Q3 implementation), COMEX-LME spread may widen to 20%;
Key minerals ( platinum, palladium, zinc, nickel, tin, lithium): 25-50% tariff risk not fully priced, or trigger import rush.
II. Macroeconomic and thematic drivers
Global Growth Path
Baseline Scenario (60%):
OBBBA bill (passed in July) stimulates the US economy in the short term, China's GDP stabilizes at 4.7%;
Fed cuts rates by 75bps in 2025 (25bps each in September/October/December) and another 50bps in 2026.
Risks:
Upside ( 20%): US/China tariffs reduced to 10% + Chinese fiscal stimulus (5% of GDP);
Downside ( 20%): failure of OBBBA to pass + continued high oil prices (suppressing rate cuts).
Tech Revolution Themes
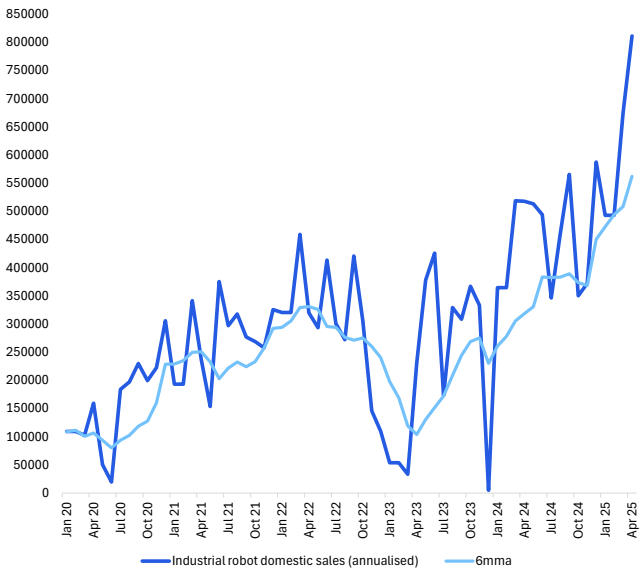
Robotics/Data Centers:
China's industrial robot production +60% YoY (800k units annualized), data center investment +100% YoY;
Capital influx or replication of the "shale revolution" type of cost reductions, long-term boost to aluminum/copper/lithium demand.
Energy transition:
Global energy storage installed capacity +27% to 250GW by 2025, strong lithium demand support;
China's PV installed capacity H2'25 may fall 39-44% (policy retreat), but wind power maintains high growth.
Commodity Asset Properties
Performance in 2025: precious metals (gold/silver/platinum) > agricultural commodities > energy, commodity curve arbitrage strategies continue to be effective (crude oil/copper shifting to contango).
Volatility strategy: volatility premium returns after geopolitical events, short volatility strategy ushered in the layout window.
Third, in-depth analysis of sub-sectors
(I) Precious Metals & PGM
Varieties | Core Points | 0-3 Months Goal | 6-12 Months Goal | Key Drivers |
|---|---|---|---|---|
Gold | Topped out and retreated | $3,300/oz | $2,800/oz | Investment Demand Peaks + Central Banks Slow Gold Purchases |
Silver | Outperforms Gold | $38/oz | $40/oz | Industrial Gap (PV + Electronics) + Investment Recovery |
Platinum | Short-term overbought | $1,150/oz | $1,200/oz | China Jewelry Replenishment + Hydrogen Policy Delay |
Palladium | Short on highs | $950/oz | $900/oz | Shrinking demand for automotive catalysts (BEV substitution) |
Silver structural shortfall:
4th consecutive year of shortage (160m oz annual shortfall), inventory costs rising to $24-25/oz (supporting prices);
PV silver consumption underestimated (+50% as measured by cell production).
(ii) Energy
Crude oil: geopolitical premium not sustainable
Price path: Q3 Brent
66/bbl → Q463/bbl → 2026 $65/bbl;Oversupply: accelerated OPEC+ production resumption (410k b/d increase in July), continued global inventory build;
Risks: loss of Iranian exports >500k bbl/d or push oil prices to $85-90/bbl.
Natural gas: regional divergence
Europe (TTF): inventories only 48% (historic low), Q3 up to €38/MWh (+8%);
US (Henry Hub): ethane export restrictions + high production, Q3 oscillating at $3.8/MMBtu;
Asia (JKM): typhoon season + China restocking, Q3 up to $12.8/MMBtu.
Uranium: demand recovery
Target:
80/lbin 2025→100/lbin 2026;Logic: global nuclear restart (Japan and Korea) + Sprott Physical Uranium ETF additions.
(iii) Industrial & Battery Metals
Varieties | Core Points | 0-3 Months Goal | 6-12 Months Target | Key Risks |
|---|
Copper | Tariff shock | $8,800/t | $9,500/t | U.S. Section 232 (25% tariff) |
Aluminum | Long-term bullish | $2,450/t | $2,800/t | Green Aluminum Capacity Bottleneck in China |
Nickel | Surplus persists | $14,000/t | $16,000/t | Indonesia NPI Production Acceleration |
Lithium | Bottom Shock | $7,000/t | $8,750/t | China's EV policy rollback |
Copper tariff impact:
U.S. imports account for 6% of the world, 25% tariffs may push up COMEX premiums by 20%;
Q3 faces de-stocking pressure after the end of import rush.
(D) agricultural products
Varieties | Core Points | 0-3 Months Goal | 6-12 Months Goal | Catalyst |
|---|
Sugar | Shortage expansion | 18¢/lb | 19¢/lb | Brazilian Pressing Delay |
Coffee. | Rain Support | 375¢/lb | 350¢/lb | Vietnam production cuts cashed in |
Cocoa | High Retracement | $8,500/t | $7,000/t | West African Supply Chain Recovery |
IV. Key Chart Support
Gold Fundamental Framework
Explanation: gold prices tend to top out and fall when the investment demand share crosses 80% (93% expected in 2025).
Long-term shortage of aluminum
Data: Shortage to reach 6 million tons by 2030 if prices remain at $2,500/t.
Geopolitical risks and oil prices
Showing that Brent needs to rise to $90/bbl to balance the market if Iran loses 1 million bbl/day of exports.
Comments