$Lyft, Inc.(LYFT)$ Q2 demonstrated its ability to transition from growth to profitability, with improvements in the driver ecosystem and breakthroughs in enterprise services driving excess returns. Short-term valuation is anchored at an EV/EBITDA of ~10x for 2025 (currently around 8x). If Q3 international integration proceeds smoothly and subscription data remains strong, the valuation center could shift upward.
The risk lies in macroeconomic sensitivity and competition. It is recommended to pay attention to the proportion of corporate orders and the progress of Freenow's collaboration.
Performance Overview and Market Feedback
Key performance indicators
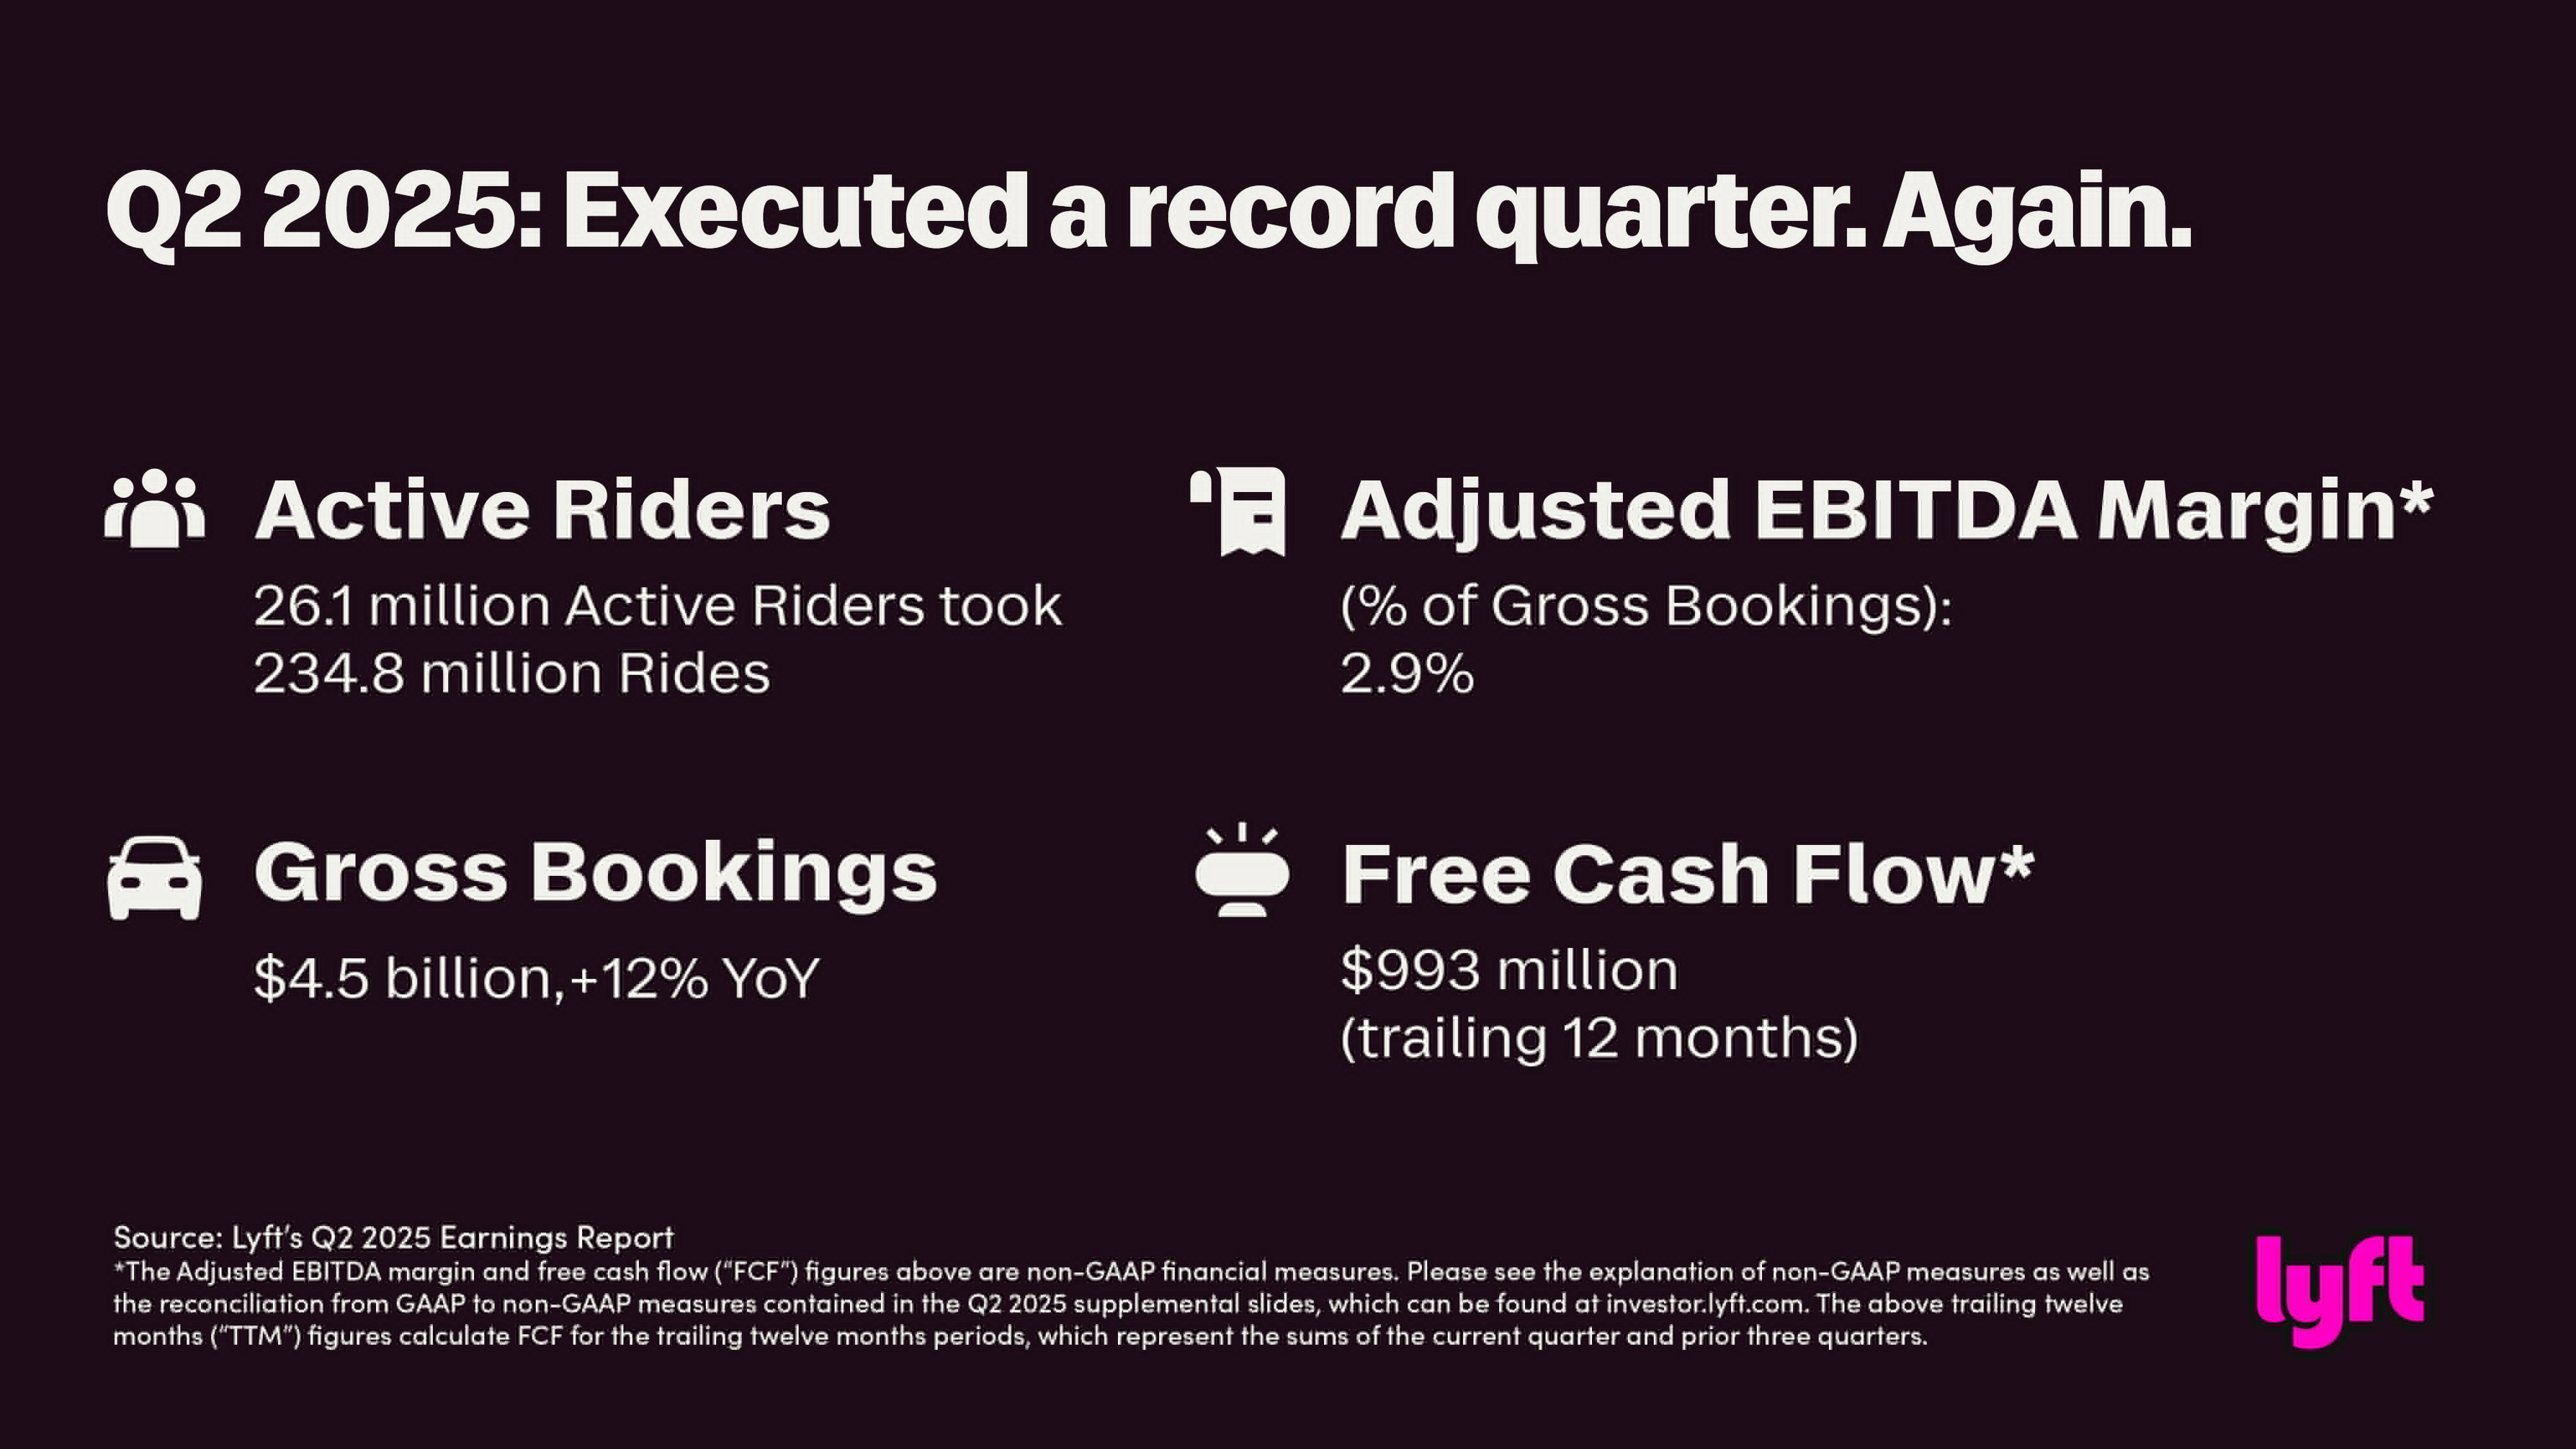
Gross Bookings: 4.49B (+124.3B).
Revenue: 1.59 billion (+111.58 billion).
Net profit: 40.3 million (5.0 million in the same period last year), net profit margin increased to 0.9% (0.1% in Q2'24).
Adjusted EBITDA: $129.4 million (+26% yoy), margin 2.9% (up 30bps).
Free cash flow: 329.4 million (+289.93 million).
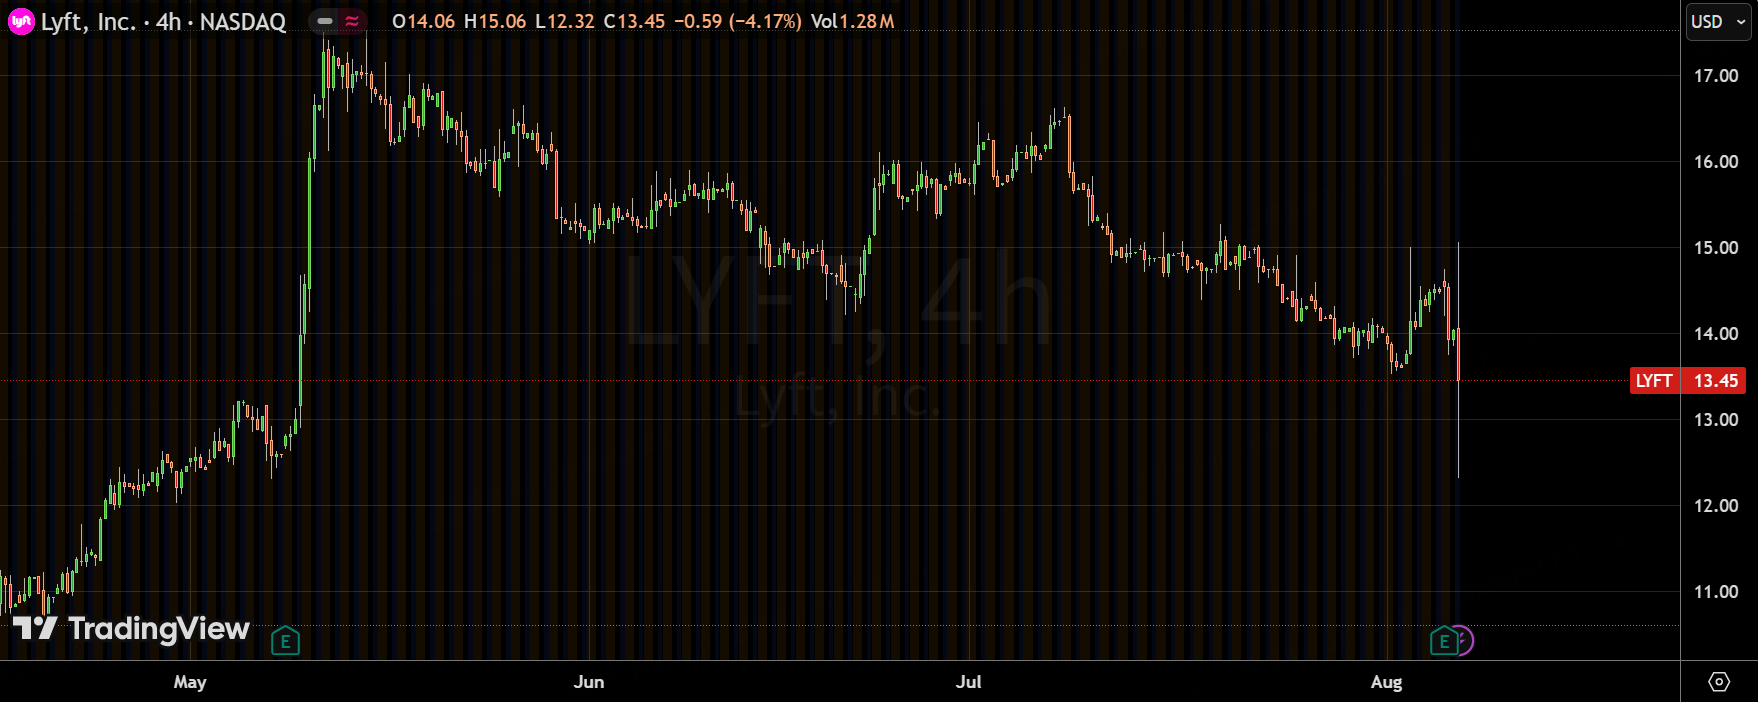
Market reaction: The stock price fluctuated significantly after the earnings report, rising 5% at one point before closing down 3%. On the one hand, this reflects the market's recognition of improved profitability and cash flow. On the other hand, it reflects disappointment with revenue falling short of buyer expectations. The Q3 booking guidance was strong (4.65-4.8 billion vs. expected 4.6 billion), but the EBITDA guidance was below expectations, reflecting concerns about revenue growth without corresponding profit growth.
Key Investment Points
The growth engine is a double breakthrough in user ecology and operational efficiency.
User scale and stickiness:
The number of active riders reached 26.1 million (up 10% year-on-year), a record high; order volume reached 234.8 million (up 14% year-on-year, double-digit growth for nine consecutive quarters).
Driver supply-side optimization: Drivers on both platforms showed a preference for Lyft of 29% (up 23pp year-over-year), reflecting the effectiveness of incentive strategies and platform experience upgrades.
High-value customer penetration:
Enterprise account users contribute a 4x premium service selection rate (such as Lyft Silver), and partnerships with United Airlines and others strengthen penetration in business scenarios.
Subscription service Lyft Silver performed better than expected: new users accounted for ~20%, retention rate ~80%, validating the feasibility of the membership model.
Profitability surge: structural cost optimization and economies of scale
Gross margin leverage: Cost control drove a 24% year-over-year increase in operating cash flow to $343.7 million, primarily due to:
Optimization of insurance reserves (reserve balance increased by **$246 million** year-on-year).
Decrease in R&D/management expense ratio (R&D ratio decreased to 6.9%, Q2'24 was 6.9%).
Sustainability of EBITDA expansion: The main reasons for the increase in profit margins are increased order density (lower average cost per order) and a higher proportion of high-margin businesses (enterprise services, subscriptions).
Strategic Catalysts: M&A and Ecosystem Partnerships Open Up TAM
Freenow acquisition completed: Closing completed on July 31, consolidation starting in Q3, significantly expanding European market coverage (adding 20 countries to the operating network).
Deepening the cooperative ecosystem:
Collaborating with United Airlines, Baidu (Apollo Autonomous Driving), BENTELER, and others, we are expanding into cross-border scenarios + autonomous driving to strengthen our B-end barriers.
Traffic data licensing (such as urban traffic planning) has become a new growth point, with gross profit margins potentially exceeding those of core businesses.
Risk and market expectation correction points
Guidance implies caution: Q3 EBITDA guidance of 125-145 million (midpoint 135 million), flat sequentially, possibly due to:
Freenow consolidated short-term costs (approximately $9 million in merger-related expenses included in Q2).
Macroeconomic sensitivity: Risk of corporate travel budget contraction.
Competitive landscape remains unchanged:
Driver preference has improved, but Uber still dominates (with a market share of approximately 70% in the US), and the effectiveness of subsidies needs to be continuously verified.
Analysts are watching to see if Lyft Silver membership growth can keep up (current penetration rate not disclosed).
Key variables for revaluation
Positive Drive:
Free cash flow generation capacity (TTM 993M) supports∗∗ shareholder returns∗∗ (Q2 repurchase of 200M shares).
If the proportion of enterprise users/subscription services increases to **>30%** (currently undisclosed), it can be benchmarked against SaaS valuation premiums.
Potential suppression:
Delays in the integration of Freenow may hinder the achievement of the 2025 international business margin target (3.0%).
If the economic downturn causes rider rates to decline, growth in booking volume may not be enough to offset the decline in ASP. $Uber(UBER)$
Comments