Exchange-traded fund investors are finally embracing stocks. After a middling start to the year, flows into U.S. equity ETFs picked up steam in the second quarter.
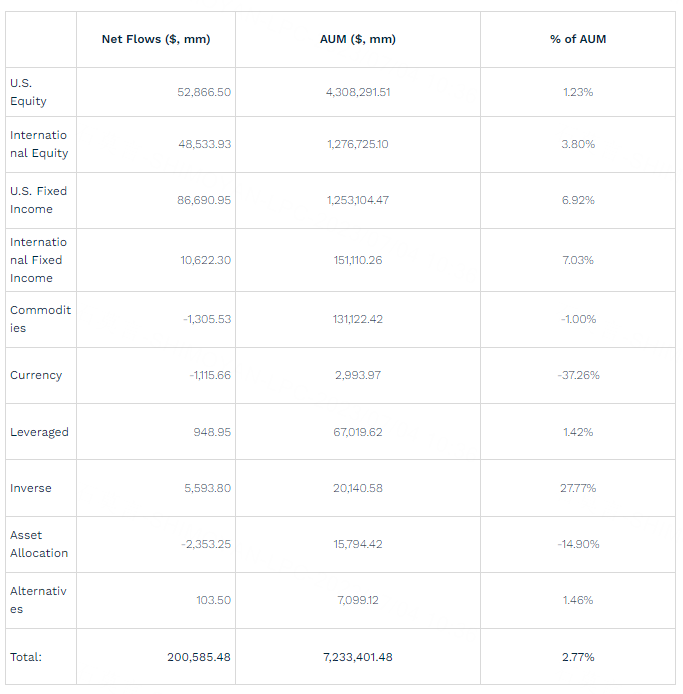
By the end of June, the year-to-date haul for U.S. stock ETFs reached $52.9 billion, a significant improvement compared to the $2.9 billion of outflows we saw at the end of the first quarter.
For context, there was $128.8 billion of inflows for U.S. equity ETFs at the end of the first half of 2022.
Over the past several weeks, investors have plowed money into U.S. stock ETFs as the market has taken off. From a 7.5% gain at the end of March, the S&P 500’s year-to-date return more than doubled to 16.8% at the end of June.
Those types of gains are hard to ignore, and the narrative that stocks aren’t that compelling with risk-free Treasuries yielding close to 5% has come under strain.
Inflows for U.S. equity ETFs are still lagging those of U.S. fixed income ETFs—$52.9 billion versus $86.7 billion—but they’re quickly catching up.
Overall inflows for U.S.-listed ETFs—which includes funds tied to stocks, bonds, commodities and more—were $200.6 billion at the end of June. That compares to $298.7 billion at the same time a year ago.
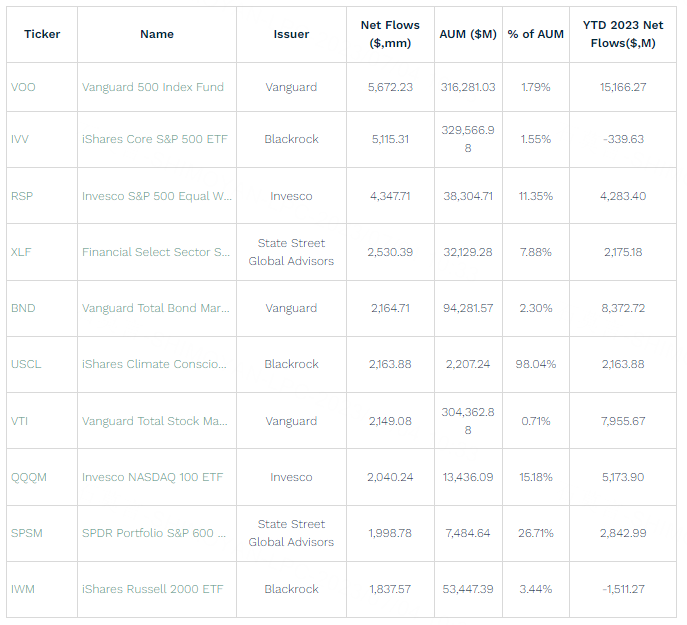
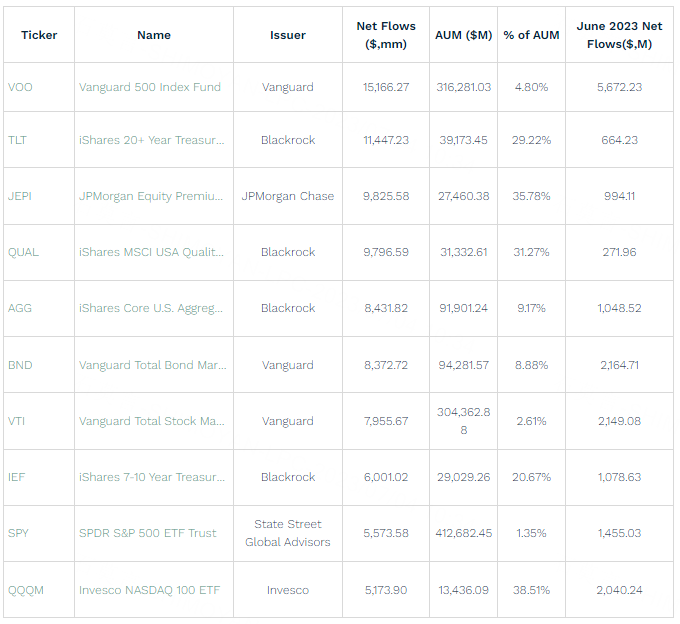
In terms of individual ETFs, the Vanguard 500 Index Fund (VOO) topped the 2023 inflows list at the end of the second quarter, with year-to-date inflows of $15.2 billion.
Taking the second and third positions on the list were the iShares 20+ Year Treasury Bond ETF (TLT) and the JPMorgan Equity Premium Income ETF (JEPI), with inflows of $11.4 billion and $9.8 billion, respectively.
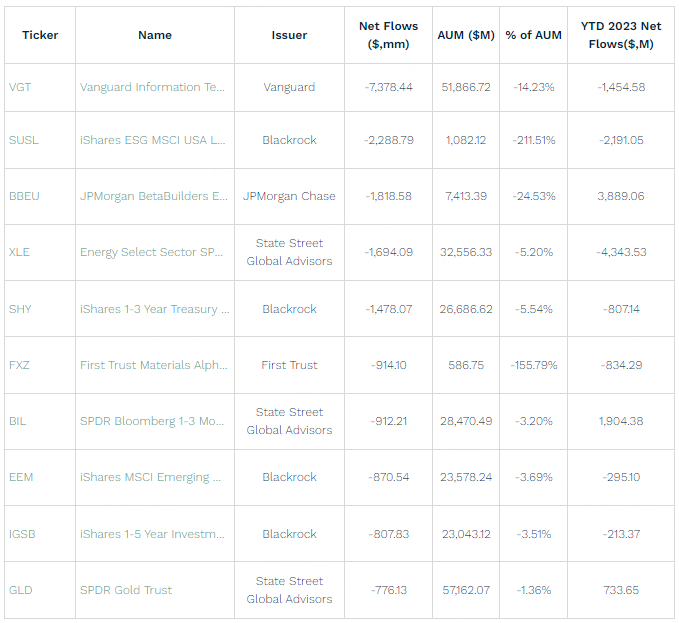
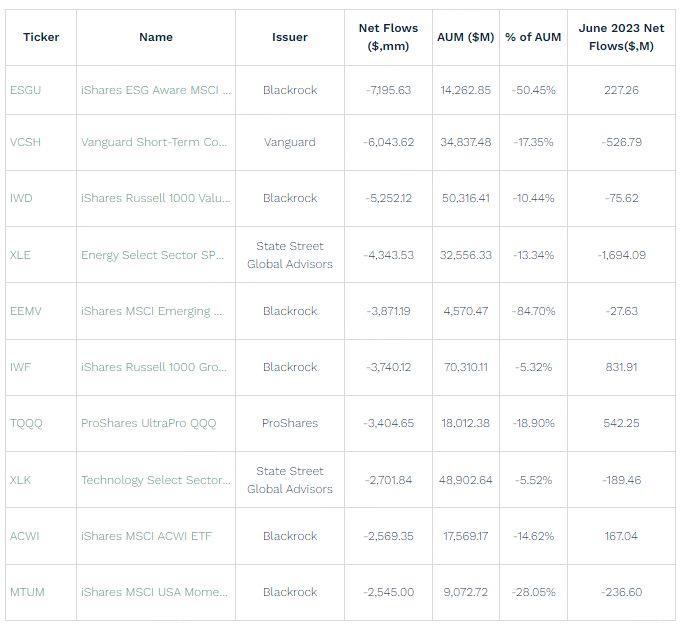
Meanwhile, on the outflows side, the iShares ESG Aware MSCI USA ETF (ESGU) was the fund with the largest year-to-date outflows: $7.2 billion.
Following suit were the Vanguard Short-Term Corporate Bond ETF (VCSH), the iShares Russell 1000 Value ETF (IWD) and the Energy Select Sector SPDR Fund (XLE).
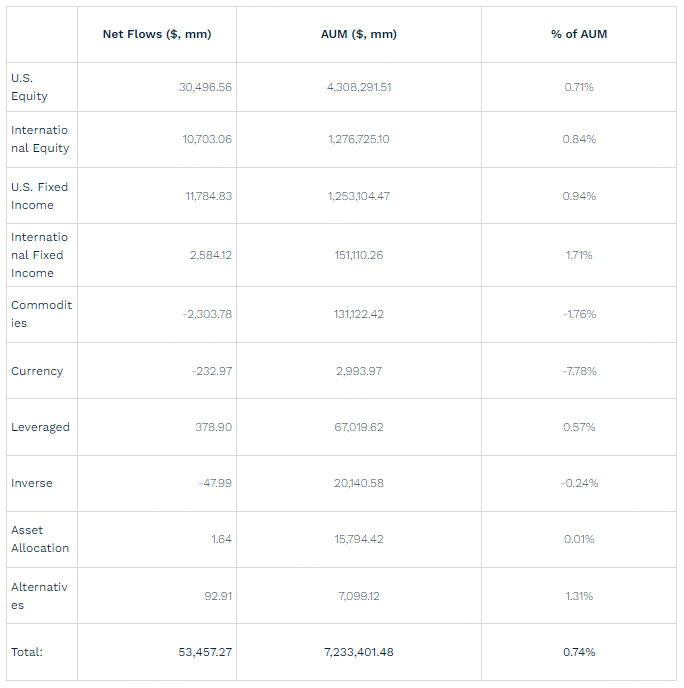
For a full list of this year’s top inflows and outflows, see the tables below: