Home Depot Inc. (NYSE: HD) shares traded higher Monday, likely in anticipation of the earnings report the company is scheduled to announce Tuesday morning before the market open. The company is expected to post increased earnings per share of $4.36 and revenue of $40.63 billion.
Home Depot was up 1.18% at $335.05 at the close.
Home Depot Daily Chart Analysis
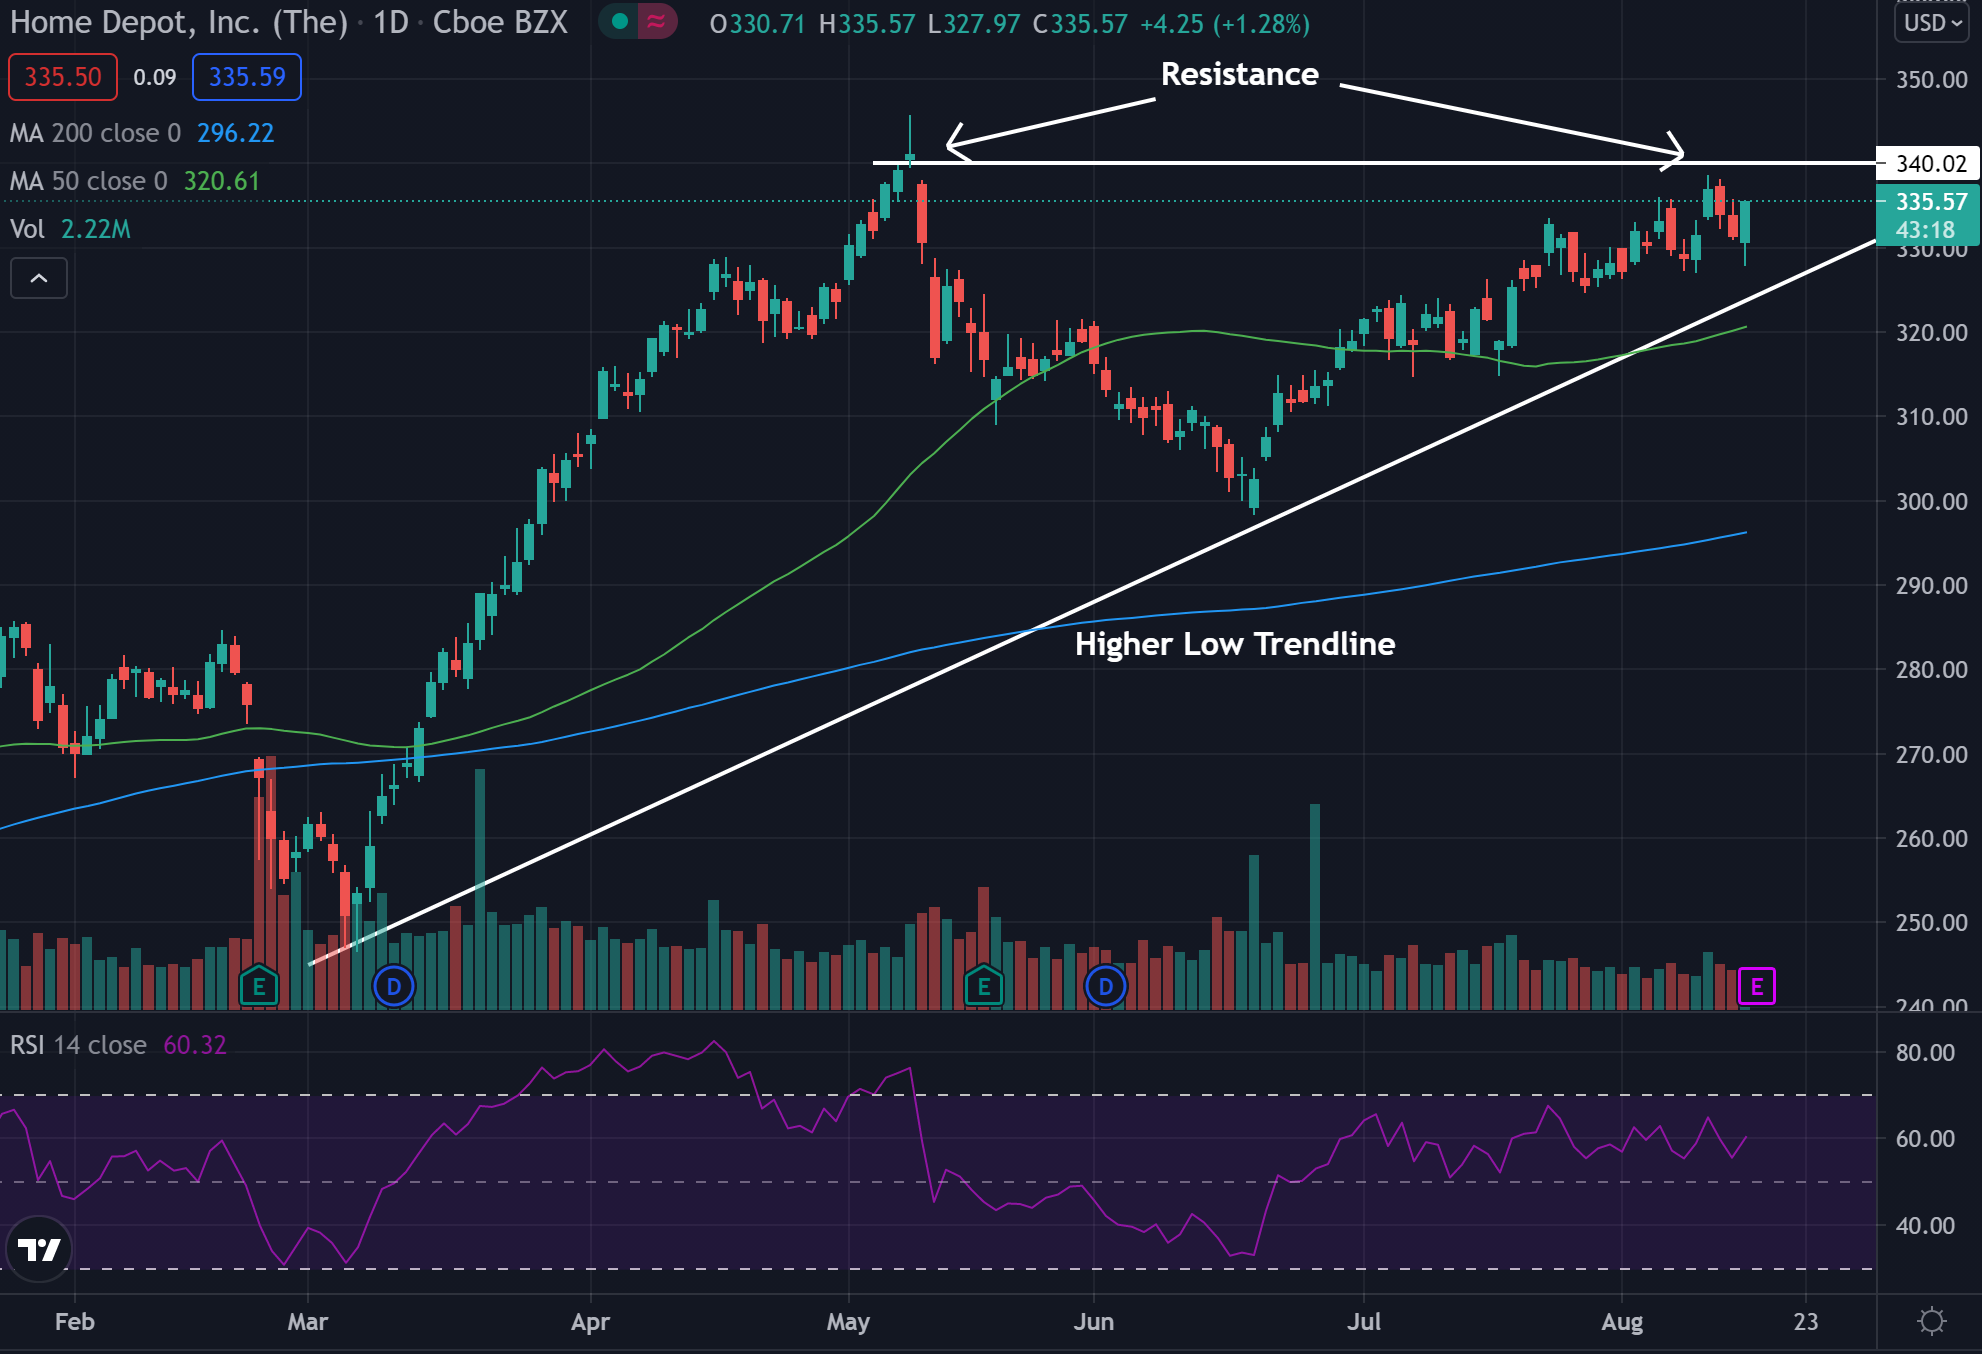
- The stock looks to be nearing resistance in what technical traders call an ascending triangle pattern.
- The stock trades above both the 50-day moving average (green), and the 200-day moving average (blue), indicating the stock is likely facing a period of bullish sentiment.
- Each of these moving averages may hold as a potential area of support in the future.
- The $340 price level has held as resistance in the past and may continue to hold as resistance. The stock has found support at the higher low trendline multiple times in the past.
- The Relative Strength Index (RSI) has been trading sideways above the middle line and sits at 60. This means there are slightly more buyers in the stock than sellers.
What’s Next For Home Depot?
Bullish traders are looking to see the stock continue to trade above the higher low trendline and then cross above resistance and see a breakout. Bulls would then like to see the stock consolidate above the resistance level for a possible further move.
Bearish traders would like to see the stock fall below the higher low trendline and be able to hold below it. This could let the stock see a further bearish push. Bears are also looking for the price to cross below the moving averages for a possible change in sentiment.


