Why Did Gold Fall Instead of Rise Amid the Sudden Iran-Israel Conflict?

Over the weekend, new developments emerged from the Middle East: the US Air Force directly bombed Iranian targets, signaling the start of a new phase in the conflict. In theory, this should be a clear sign of escalating tensions, yet gold’s reaction was surprisingly muted. After a slight gap up on Monday, gold quickly lost momentum. Does this mean the medium- to long-term rally in gold has come to an end?
Let’s first analyze why gold did not perform as expected from a fundamental perspective. The reason is straightforward: Iran is all talk and lacks the real strength and resolve to engage in a direct confrontation. While Israel and the US have taken a tough stance, Iran’s response has been lackluster. On one hand, a full-scale war could exacerbate internal divisions, leading to significant political uncertainty. On the other hand, considering the advanced age of Iran’s leadership, dragging things out is preferable to risking total defeat. This explains why, following the latest news, crude oil, gold, and US stocks only showed minor fluctuations as a gesture of acknowledgment. Unless Iran chooses a self-destructive path and escalates dramatically, there will be no decisive outcome.
Does this mean gold’s rally is over? Let’s look at the historical monthly chart for gold: in previous major tops or correction phases, gold has rarely reversed in a single month. More often, the market forms a double top or a secondary high, with this process spanning several months. If this pattern holds, gold is currently in the process of forming a top, but a sudden collapse is unlikely. The key focus is whether gold can set new highs in the next one to three months, which will be critical in determining the strength of the trend. In other words, if gold fails to make clear new highs (excluding false breakouts) and the rally stalls, the longer it consolidates or fluctuates sideways, the greater the likelihood of a major top. At the same time, since the probability of a direct reversal is low, a sharp correction in the short term could actually present a rebound opportunity.
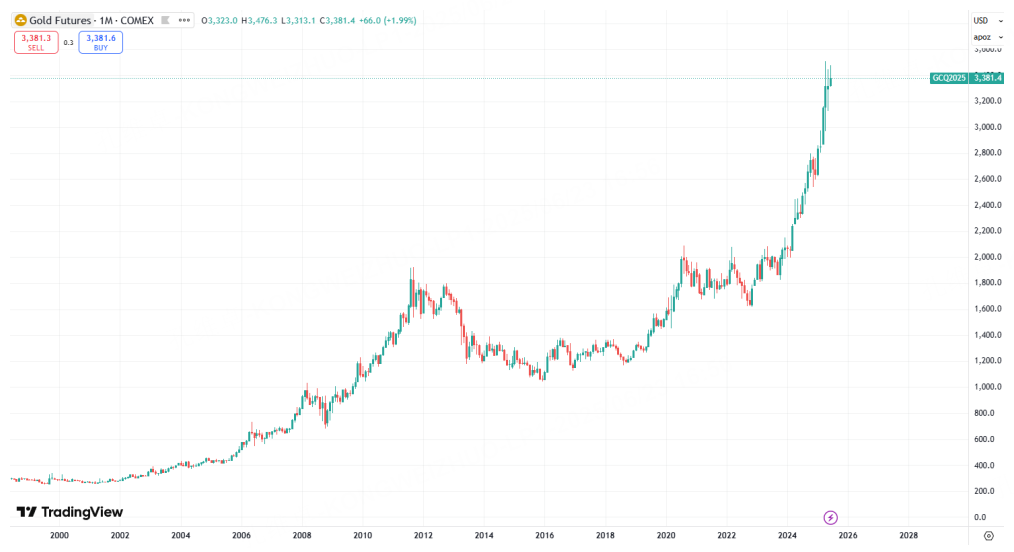
Looking at daily and weekly price levels, the 3509 high is a key resistance level for gold; only a breakout above this point could extend the rally, but there is also the risk of a false move, as the market may have overextended itself in the first half of the year. On the downside, if a correction begins, there is a real risk of gold sliding back to 3100 or even 3000. This area represents a relatively low-risk buying opportunity, with potential for a rebound and continued consolidation once prices stabilize.
In terms of strategy, near previous highs, one could consider slightly out-of-the-money or at-the-money put options to speculate on a pullback. Alternatively, when the gold-silver ratio falls back to the 92/90 range, it may be an opportunity to go long on gold and short on silver again. If the correction continues, it is recommended to wait for the aforementioned price zones before buying on dips.
$NQ100指数主连 2509(NQmain)$ $SP500指数主连 2509(ESmain)$ $道琼斯指数主连 2509(YMmain)$ $黄金主连 2508(GCmain)$ $WTI原油主连 2508(CLmain)$
Disclaimer: Investing carries risk. This is not financial advice. The above content should not be regarded as an offer, recommendation, or solicitation on acquiring or disposing of any financial products, any associated discussions, comments, or posts by author or other users should not be considered as such either. It is solely for general information purpose only, which does not consider your own investment objectives, financial situations or needs. TTM assumes no responsibility or warranty for the accuracy and completeness of the information, investors should do their own research and may seek professional advice before investing.
- jinglese·06-24Interesting analysisLikeReport