The U.S. stock earnings season begins, how to play leading hedging strategies?
The S&P 500 and Nasdaq Composite both hovered near all-time highs, and markets remained unchanged despite the escalation of tariffs and the intensification of monetary policy debates. Last week, the Nasdaq led gains by 1.6%, the S&P 500 climbed 0.7%, and the Dow Jones Industrial Average was basically flat.
In the coming week, 112 S&P 500 constituent stocks will announce quarterly reports, and the market focus will be on technology giants such as Google and Tesla.
At the same time, economic data will usher in indicators of manufacturing and service activity, and the Federal Reserve has entered a period of silence ahead of its July 29-30 policy meeting.
In a speech in new york on Thursday, Federal Reserve Governor Waller explicitly called for an interest rate cut in July, saying that the Federal Funds rate was more than 1 percentage point higher than the reasonable level. "With inflation nearing target and limited upside risks, we shouldn't wait until the labor market worsens to act."
But market expectations for rate cuts continue to cool-the CME FedWatch tool shows that the probability of a rate cut in July has dropped to 5% from 13% a month ago.
Hollenhorst, chief economist of Citi, believes that as the job market is further loosened and tariffs do not trigger widespread inflation, the Federal Reserve may reach a consensus on cutting interest rates in September.
The second-quarter earnings season kicked off with the unexpected performance of large banks, and the streaming media giant Netflix subsequently handed over outstanding report cards, all showing that U.S. consumption is full of resilience.
According to FactSet data, the overall earnings of S&P 500 constituent stocks are expected to increase by 5.6% year-on-year, higher than last week's forecast of 4.8%. However, some stocks that rose sharply ahead of schedule had a lackluster response after the financial report was announced. For example, Netflix's stock price fell 5% despite raising its full-year revenue guidance.
Analysts at William Blair pointed out: "Excellent earnings can hardly exceed overly inflated expectations."
Julien Emmanuel, head of equity derivatives strategy at Evercore ISI, warned that after the index rebounded 30% from April lows, the P/E of the S&P 500 has reached 24.7 times, meaning that even strong performance can only maintain the current high. A slight fall short of expectations could trigger a significant correction.
The "Big Seven" and Market Diffusion Expectations
$Google (GOOG) $And$Tesla (TSLA) $Will start the quarterly earnings release of the "Big Seven" technology stocks. This batch of stocks is expected to once again lead the S&P 500's earnings growth this quarter.
Second-quarter earnings of the "Big Seven" are expected to increase 14.1% year-over-year, while earnings of the remaining 493 stocks in the index are expected to increase only 3.4% year-over-year. This means that the probability of S&P 500 earnings beating expectations depends largely on the performance of big tech companies.
But as the chart below shows, the market generally expects the remaining 493 stocks to start contributing a larger percentage of earnings growth in the coming quarters-a key signal that Wall Street strategists are looking forward to, who want to see what has only been sporadic in the past few years. The stock market rally can spread.
"Now is the time to cash in on earnings," Citi strategist Scott Kronert wrote in a note to clients. "Corporate commentary will be crucial if we want to see the correction room open further, and we hope that the growth of cyclical industries will have an inflection point, which will eventually drive the market spread."
He added: "The problem is the current market environment. It feels like the market is reflecting positive developments ahead of time. As we have always stressed, sentiment is high and implied growth expectations are high."
For investors who are worried during the earnings season, they can consider using the collar strategy to make appropriate hedging.
What exactly is the collar strategy?
To protect the downside risk of stocks, there is a strategy of buying put options (Protective Put), and to reduce the cost of holding stocks, you can sell Covered Call options (Covered Call). In order to take care of both, Collar options-this new strategy was born.
The operation method of collar option is to buy an out-of-the-money put option as insurance on the premise of holding stocks, and at the same time sell an out-of-the-money call option to pay the cost of insurance. This is equivalent to putting a Collar on the stock, and the income of the stock is locked in it, hence the name of the Collar option. The collar option is in fact a combination of Protective Put and Covered Call, which limits the risk of downside at the expense of removing some of the possibility of upside profit.
Collar options are available when traders have a bullish position in the underlying market and want to protect the position from market downside shocks. When the full cost of a put option is covered by selling a call option, it is called a zero-cost collar strategy.
Tesla Collar Options Strategy Case
Suppose an investor holds 100 shares of Tesla with a current price of $329.65. The investor is not sure how the price will change in the near future and wants to buy an insurance policy for his position. You can use the collar strategy.
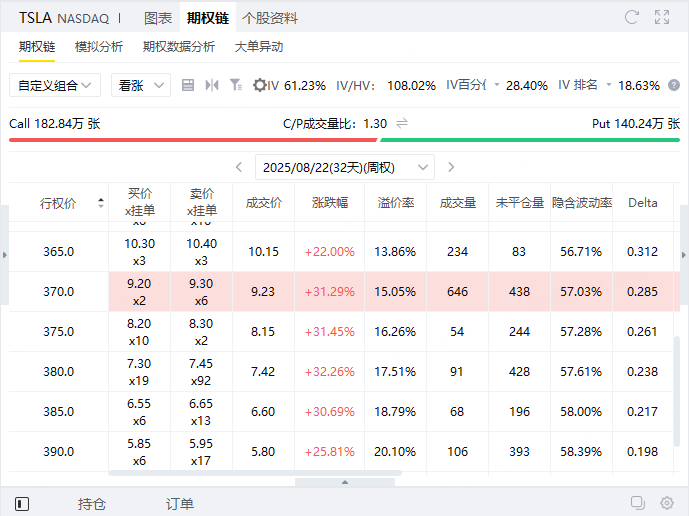
In the first step, investors can sell a call option with an exercise price of $370 and an expiration date of August 22 at a price of $9.23, earning $923.
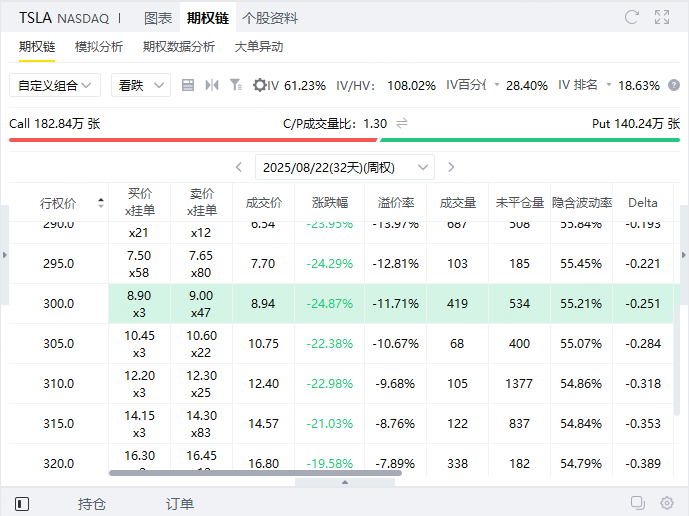
In the second step, you can also buy a put option with an exercise price of $300 and an expiration date of August 22 at a price of $8.94 (costing $894).
Stocks held: Tesla (TSLA), 100 shares, current market price of $329.65, total value of about $32,965;
Sell a Call option (Call):
The exercise price is US $370, the expiration date is August 22, and premium is US $9.23 per share (total receipts$923);
Buy a Put option (Put):
The exercise price is US $300, the expiration date is August 22, and premium is US $8.94 per share (total cost$894);
Premium Net Revenue:
Revenue: Get by selling Call$923
Spending: Buy Put Spending$894
Net income:+29 USD
Profit and loss analysis:
Maximum benefit (cap):
When Tesla closes ≥ $370:
Stocks can be sold at up to $370 (exercised by the Call buyer);
Equity Earnings: 370-329.65 =$40.35/Share, total$4035
With premium net income of $29, the total maximum benefit is:4035 + 29 = $4064
Maximum loss (lower limit):
When Tesla closes ≤ $300:
Stocks are sold at up to $300 (Put is executed);
Stock loss: 329.65-300 =$29.65/Share, total$2,965
Subtracting net premium income of $29, the largest loss is:2965-29 = $2936
Break-even point:
Stock Bid Price-Net premium Income
I.e. 329.65-0.29 =$329.36
Disclaimer: Investing carries risk. This is not financial advice. The above content should not be regarded as an offer, recommendation, or solicitation on acquiring or disposing of any financial products, any associated discussions, comments, or posts by author or other users should not be considered as such either. It is solely for general information purpose only, which does not consider your own investment objectives, financial situations or needs. TTM assumes no responsibility or warranty for the accuracy and completeness of the information, investors should do their own research and may seek professional advice before investing.
