At the beginning of last week, Trump “threatened” to fire Powell, then later stated he did not plan to dismiss the current Federal Reserve Chairman and hinted at lowering tariffs on China. This caused gold prices to spike and then retreat-a rare volatile movement.
These remarks signaled a softening of Trump’s previously hardline stance on tariffs and Fed policy, easing the market’s risk-aversion sentiment to some extent. Since much of gold’s price increase since Trump took office has been driven by safe-haven demand, a shift in Trump’s attitude could trigger a sharp “stampede-like” sell-off among bullish investors, commonly known as a “long liquidation” or “long-unwinding” style correction.
1. What is a “Long Liquidation” Style Sell-Off?
In a bull market, when negative news is scarce, most market participants rush to buy the asset, driving prices rapidly upward. However, because long positions become overcrowded (where even a small volume of long trades can push prices higher), many investors who bought at high prices tend to feel uncertain or hesitant.
Therefore, when even minor negative news emerges, these long holders fear a large pullback or losses and quickly sell their positions. Since these sales occur at elevated price levels where buyers are scarce, few bargain hunters step in to support the price. This triggers a cascade of selling as traders rush to exit, causing a sharp, accelerated price drop.
Because the main selling pressure comes from existing long holders closing their positions, this scenario is called a “long liquidation” or “long-unwinding” style sell-off (basically, a race among longs to exit first).
This type of price action is common in bull markets across stocks and commodities and can inflict serious short-term damage-especially on leveraged traders. The sharp correction often shakes investors’ confidence, pushing some long-term holders to abandon their positions. Traders must remain vigilant and manage their risks accordingly.
2. Expected Scale of the Gold Price Correction
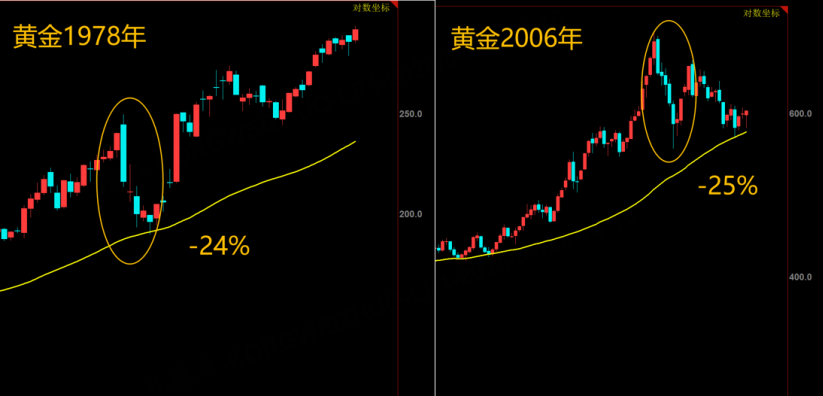
Typically, this type of “long liquidation” decline does not alter the asset’s long-term trend. Therefore, it is more appropriate to assess the overall market direction using long-term moving averages. Currently, the 20-month moving average serves as a reliable benchmark for gold’s long-term trend, sitting around 2600–2700 points.
Compared with the recent gold peak near 3500 points, this suggests a potential decline of about 25%, consistent with historical corrections of similar nature. The adjustment period is usually brief-such sharp corrections tend to complete within approximately one month.
Investors should evaluate their portfolio in light of these parameters and prepare accordingly.
For long-term investors holding positions acquired at low costs, this can be treated as a typical short-term correction and largely overlooked. However, investors with high entry costs and leveraged positions are advised to reduce their leverage to mitigate risk. Speculators may consider buying put options to profit from or hedge against the rapid decline; this strategy limits losses to the option premium while offering significant upside if prices fall.
$E-mini Nasdaq 100 - main 2506(NQmain)$ $E-mini S&P 500 - main 2506(ESmain)$ $E-mini Dow Jones - main 2506(YMmain)$ $Gold - main 2506(GCmain)$ $WTI Crude Oil - main 2506(CLmain)$
Comments