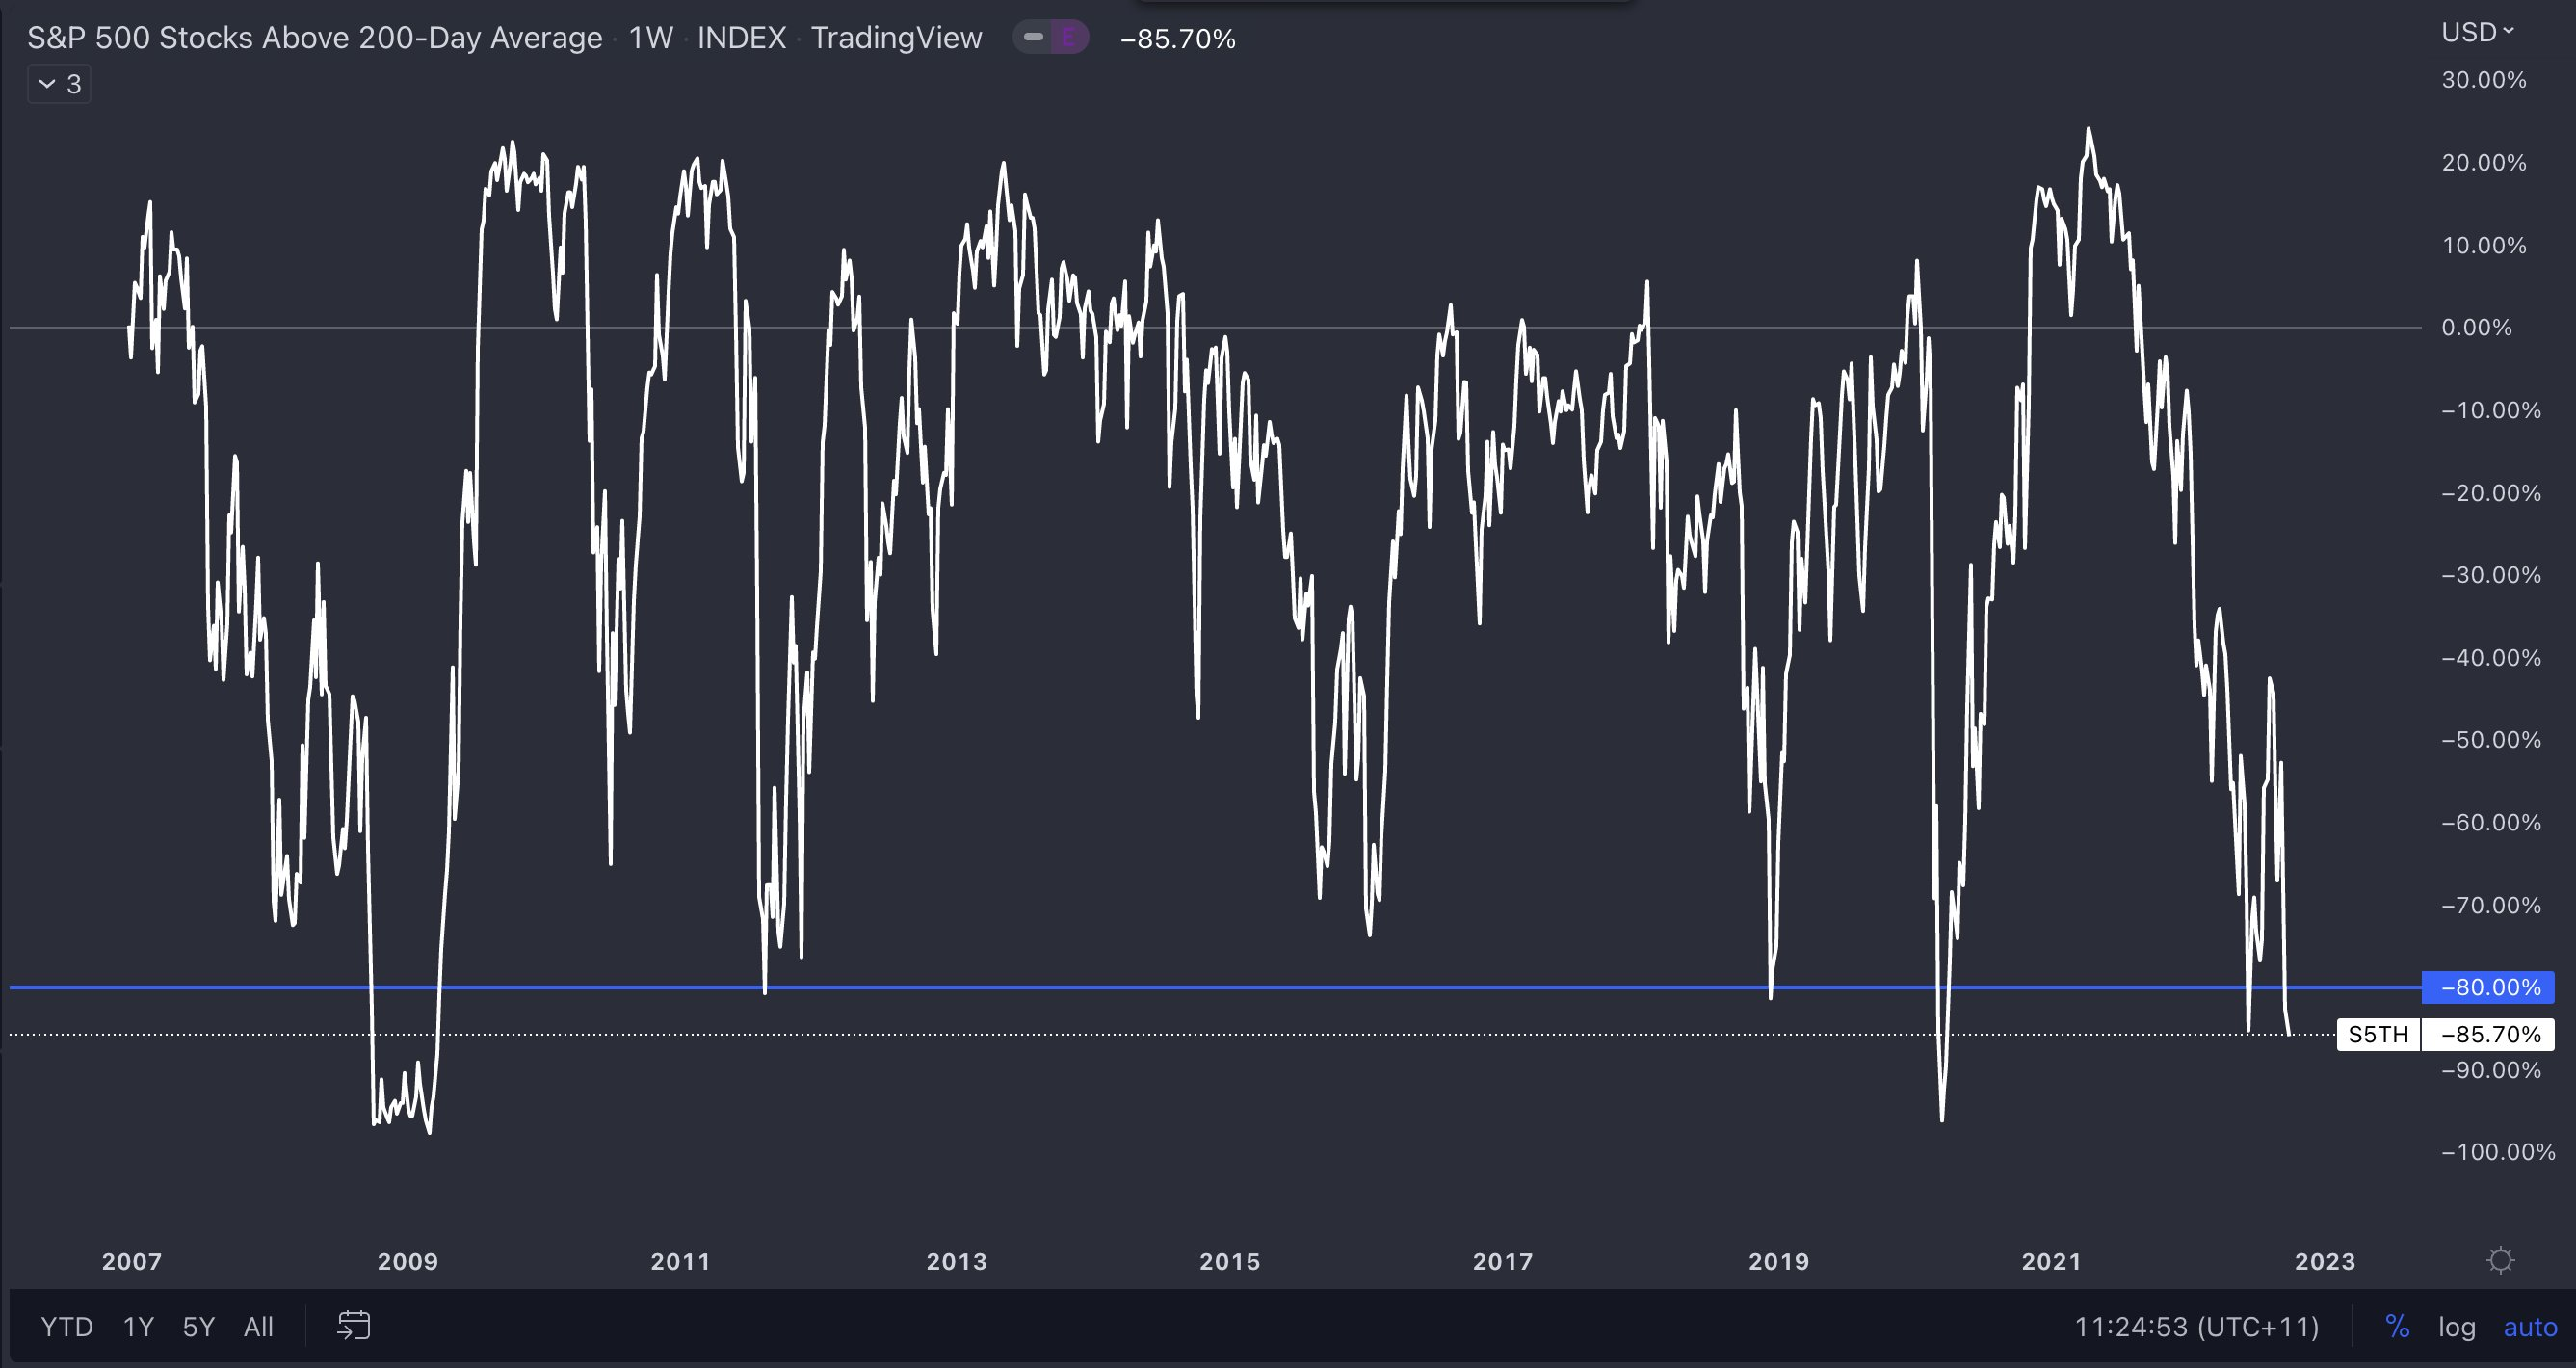
This chart (ticker: S5TH) shows the percent of stocks trading above/below their 200DMA (one of the most common indicators) dating back to 2007. Currently, 85.7% of stocks in the #SPX are trading below their 200DMA. This is entering territory seen during the #GFC & #COVID crashes.
$S&P 500(.SPX)$
Follow me to learn more about stock moves!!
Technical Analysis
Here is the place for you to discuss & learn about technical analysis.
Disclaimer: Investing carries risk. This is not financial advice. The above content should not be regarded as an offer, recommendation, or solicitation on acquiring or disposing of any financial products, any associated discussions, comments, or posts by author or other users should not be considered as such either. It is solely for general information purpose only, which does not consider your own investment objectives, financial situations or needs. TTM assumes no responsibility or warranty for the accuracy and completeness of the information, investors should do their own research and may seek professional advice before investing.
Comments