Topping Risk Persists in U.S. Stocks: Consider Gold and VIX on Pullbacks?
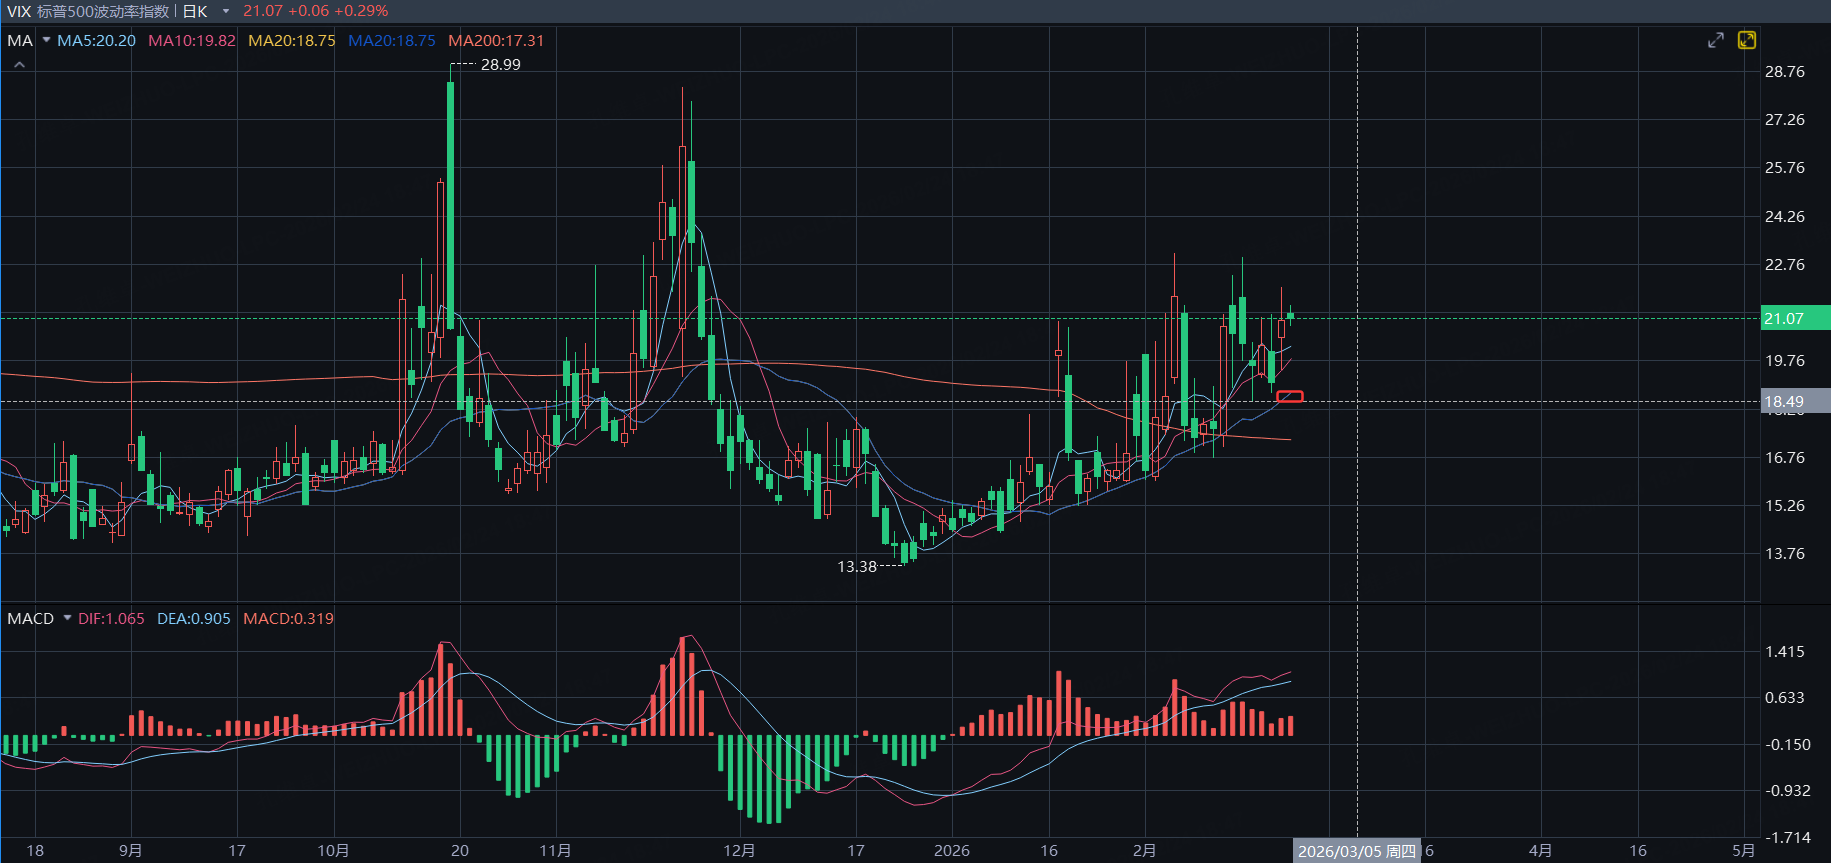
Ahead of the holiday, I told everyone to temporarily consider taking profits on bullish positions in the U.S. equity market, and to look at building small long put option positions once the S&P moved below its 20-week moving average; alternatively, you could try buying VIX-long exposure on dips, using the VIX 20-day moving average as the stop level. From what we’ve seen so far, the VIX-long position should already be profitable:
$Cboe Volatility Index(VIX)$ $ProShares VIX Short-Term Futures ETF(VIXY)$ $ProShares Ultra VIX Short-Term Futures ETF(UVXY)$ $Volatility Index - main 2603(VIXmain)$
My strategy remains unchanged: I’m still holding a small-sized long put option position on SPY and maintaining a bullish position in VIX, waiting for the current standoff in the market to resolve. Before the holiday, I explained in detail why I’ve remained bearish on U.S. equities, and it is not simply because the technical structure has shown a clear topping formation. More importantly, from the broader volatility logic of U.S. Treasury yields, whether yields rise or fall—and whether the U.S. dollar index rises or falls—either path can add downside selling pressure to U.S. equities sitting at elevated levels; the specific reasoning can be revisited in the prior strategy discussion.
$S&P 500(.SPX)$ $SPDR S&P 500 ETF Trust(SPY)$ $E-mini S&P 500 - main 2603(ESmain)$ $Micro E-mini S&P 500 - main 2603(MESmain)$
So, after another week, has the macro operating logic of the U.S. equity market changed? It has not. U.S. equities are still stuck in a high-level, weak, range-bound stalemate, and bearish anxiety has not eased—if anything, it has picked up somewhat.
This bear-market tone is coming from the tug-of-war between Trump and the U.S. Supreme Court over whether the latest tariff policy can be implemented. Although the Supreme Court has temporarily rejected Trump’s earlier decision to impose additional tariffs, I believe this is likely only the beginning of disorder and confusion—not the end. Given Trump’s personality, there is a high probability he will pursue additional legal avenues to push the tariff policy through again, while the Court continues its war of words with him, leaving expectations more blurred and uncertain.
The Supreme Court’s rejection of Trump’s tariff plan marks a turning point in U.S. politics—from a period of Trump dominating to one of heightened contention and confrontation. Going forward, any attempt by Trump to advance policy may not be so smooth, and this is happening right ahead of the November midterm elections. Moreover, the Supreme Court and Trump are operating from completely different interest positions: Trump’s tariff war aims, first, to use tariff revenue to offset today’s fiscal deficit and push down Treasury yields, and second, to gain more leverage for extracting concessions in future negotiations with other countries. But this plan may now be facing an unprecedented threat.
As for the Court’s stated objective, on the surface it is to reduce inflationary pressure caused by tariffs; in practice, U.S. inflation has been fairly stable over the last several quarters.
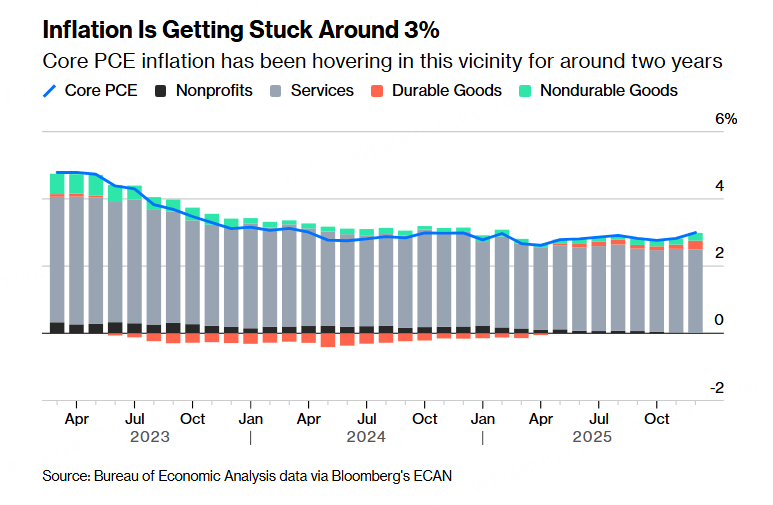
What matters behind the scenes is that the Court’s rejection sharply undermines expectations for nearly 2.5 trillion dollars of tariff revenue over the next decade under the Trump administration, which is a substantial fiscal shock. From my perspective, for U.S. equities, a sudden rejection of tariff policy is definitely not good news.
According to Bloomberg’s estimates, total tariff revenue expected from 2026 to 2035 is about 2.4 trillion dollars; if the policy is completely abolished, tariff revenue would be only 704 billion dollars—less than half.
Why do I still insist on the strategy of buying puts only after the S&P is below its 20-week moving average?
Let’s look at the technical picture.
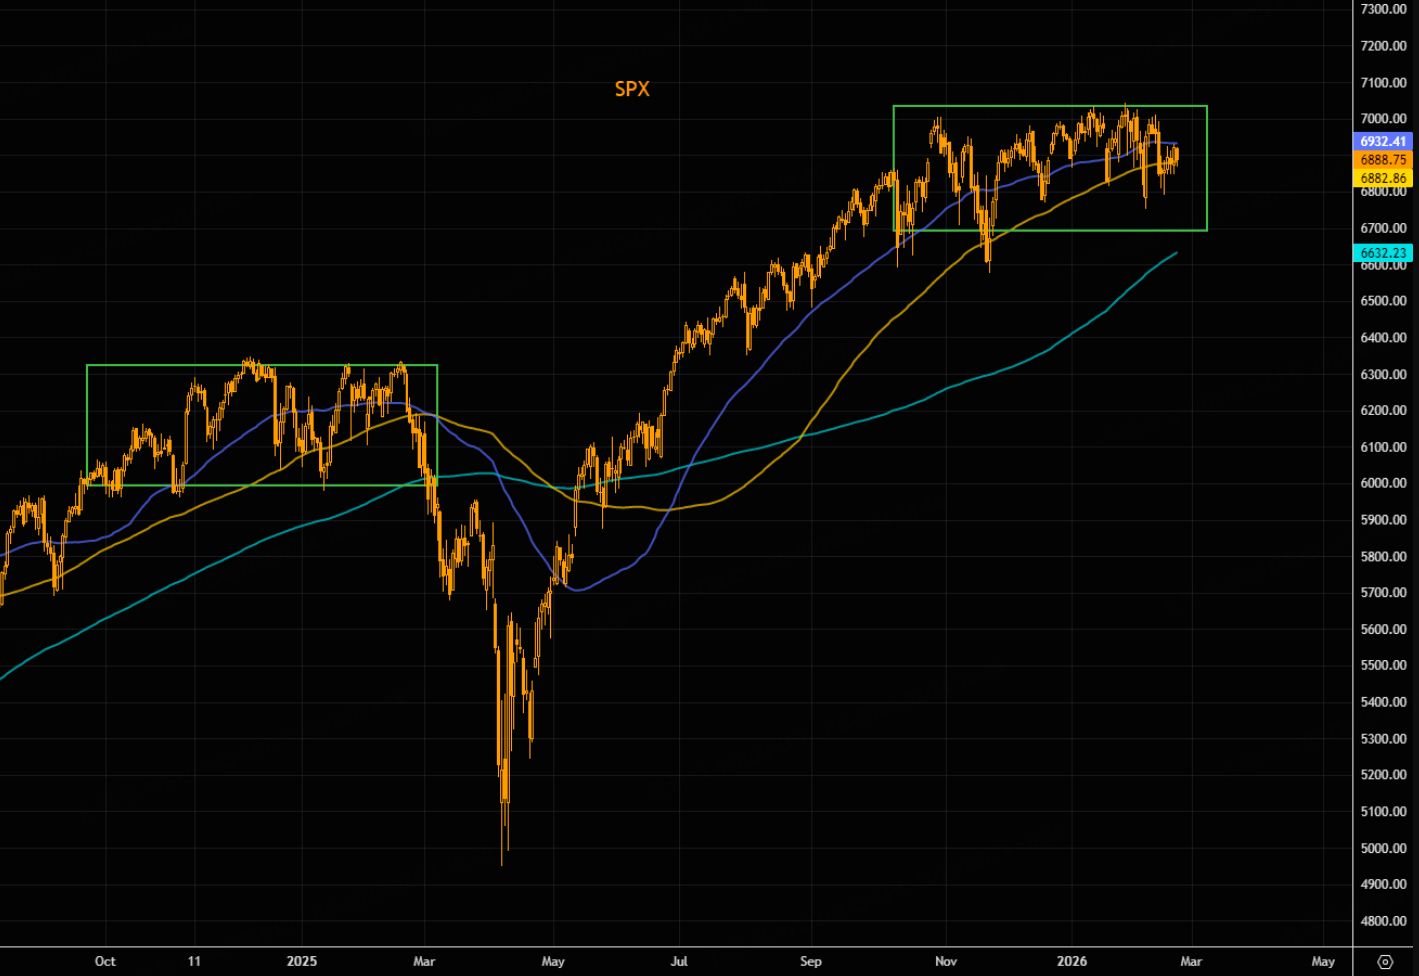
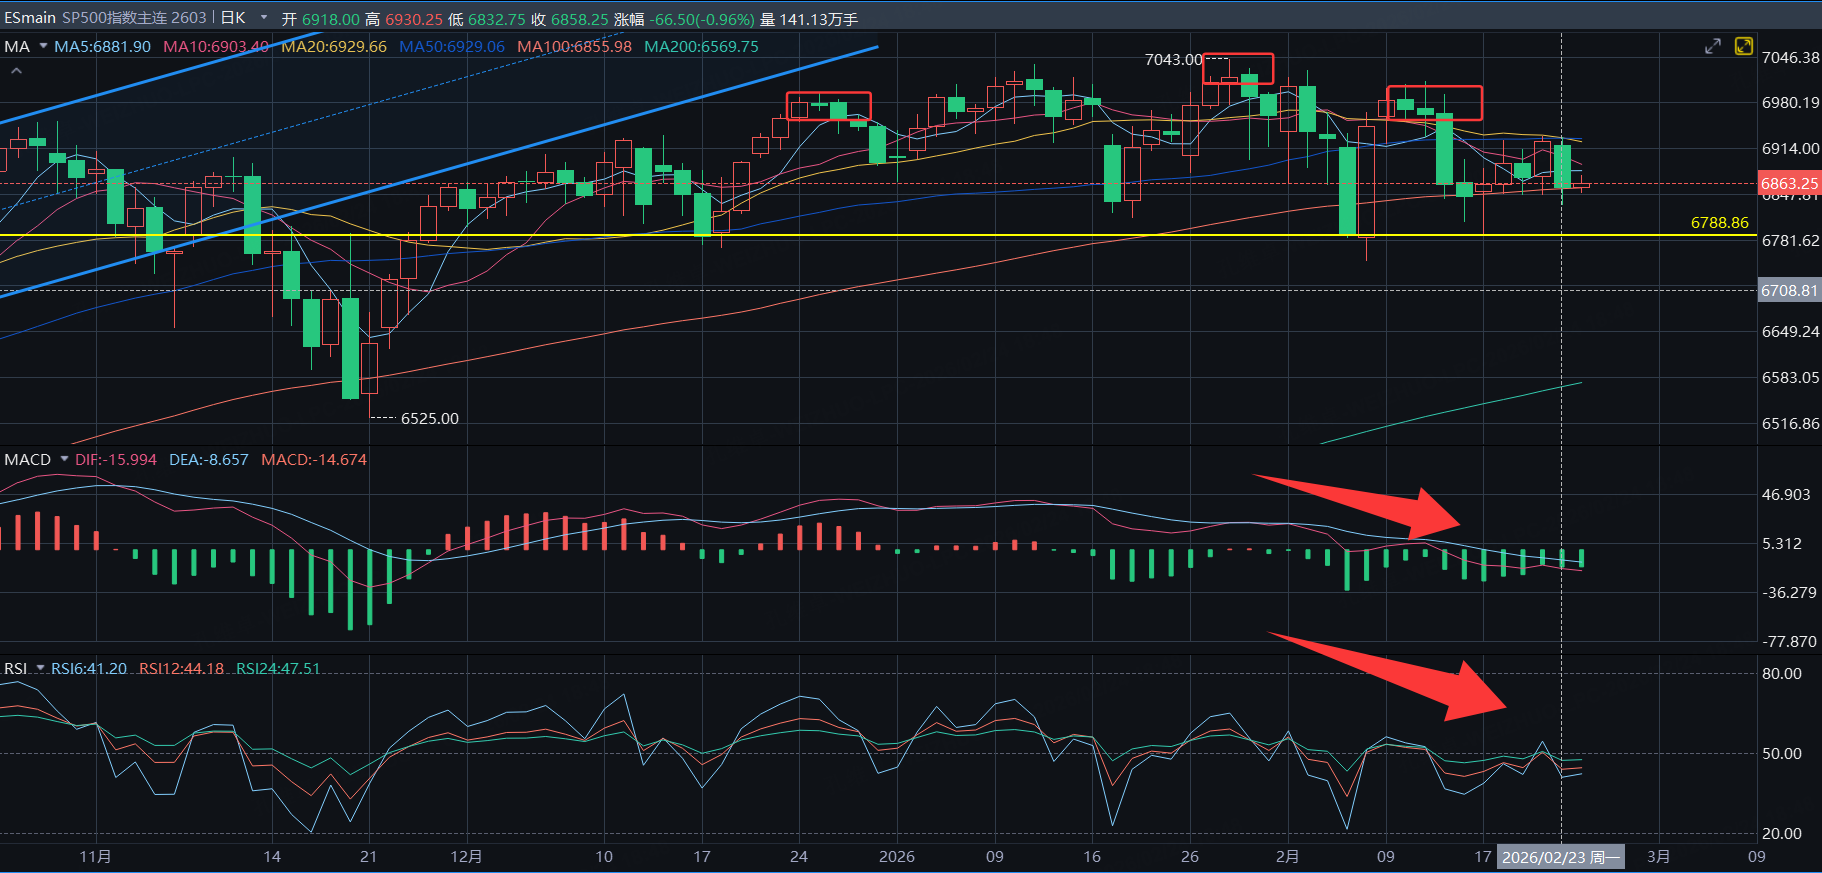
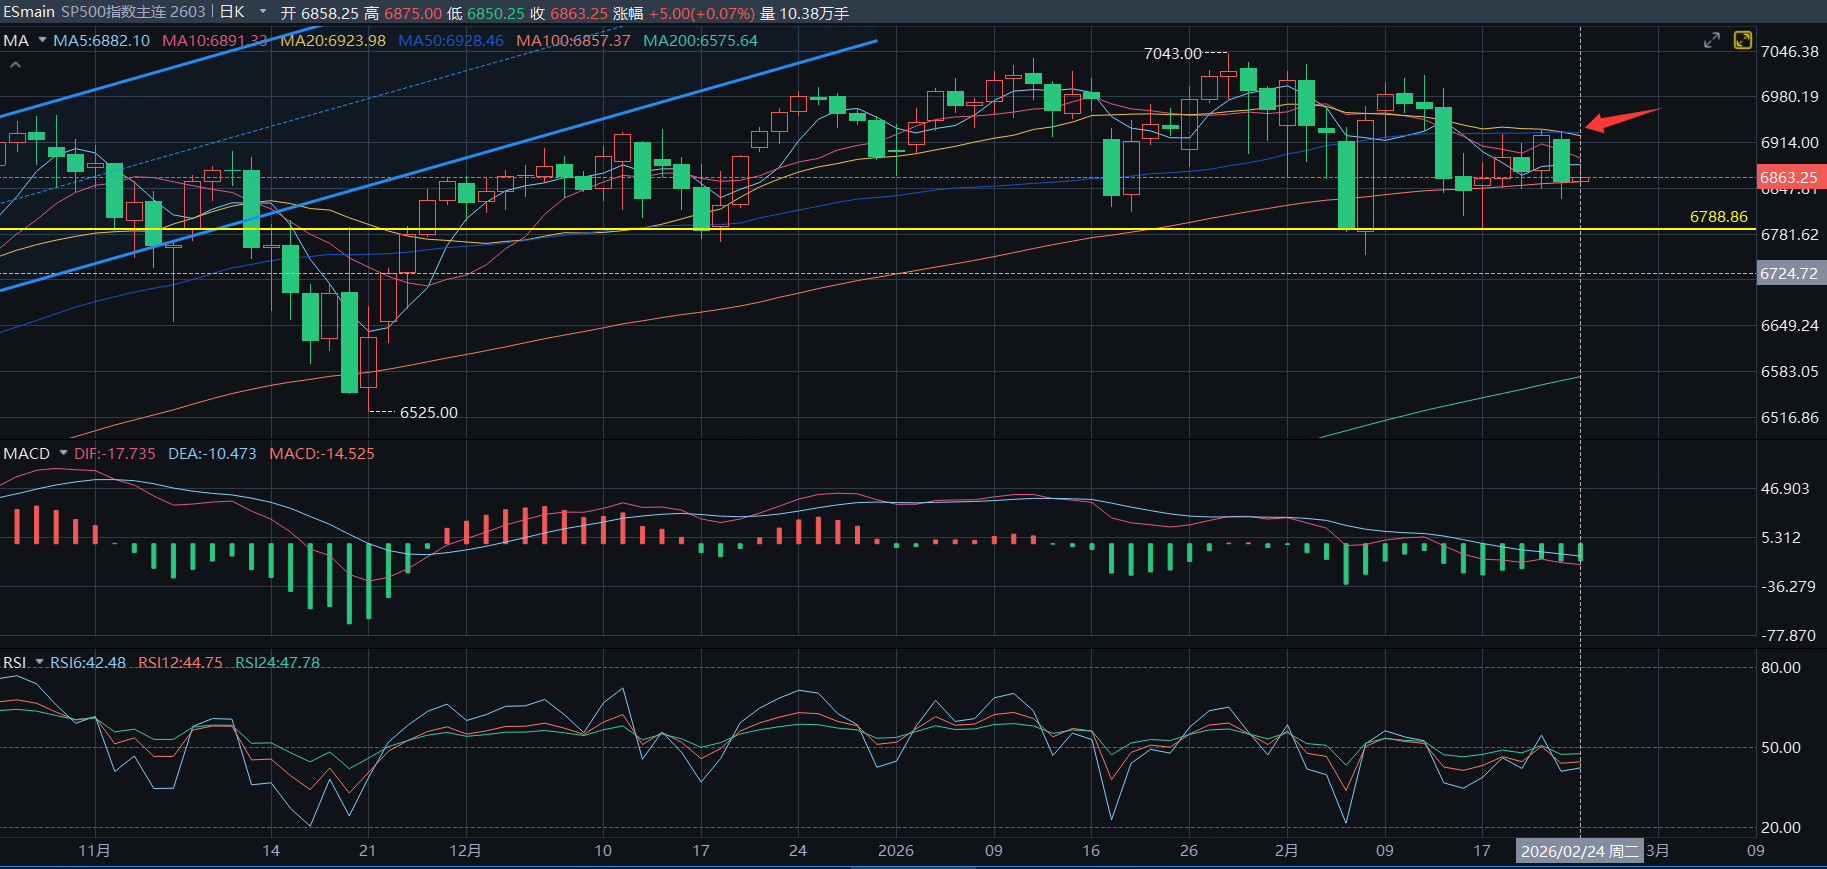
The S&P is still oscillating inside a high-level box range. The 50-day moving average is about to cross below the 100-day moving average, which points to weakening price action. If the index breaks below the lower boundary of the range, a large decline could follow—so we have to stay on guard. From the current S&P futures structure, the 20-day moving average has become a hard short-term ceiling, and multiple attempts to push higher and break through have failed. So we simply need to keep a close eye on the yellow support line in my chart, which aligns with the 20-week moving-average support area:
$Invesco QQQ(QQQ)$ $NASDAQ(.IXIC)$ $E-mini Nasdaq 100 - main 2603(NQmain)$ $Micro E-Mini Nasdaq 100 - main 2603(MNQmain)$
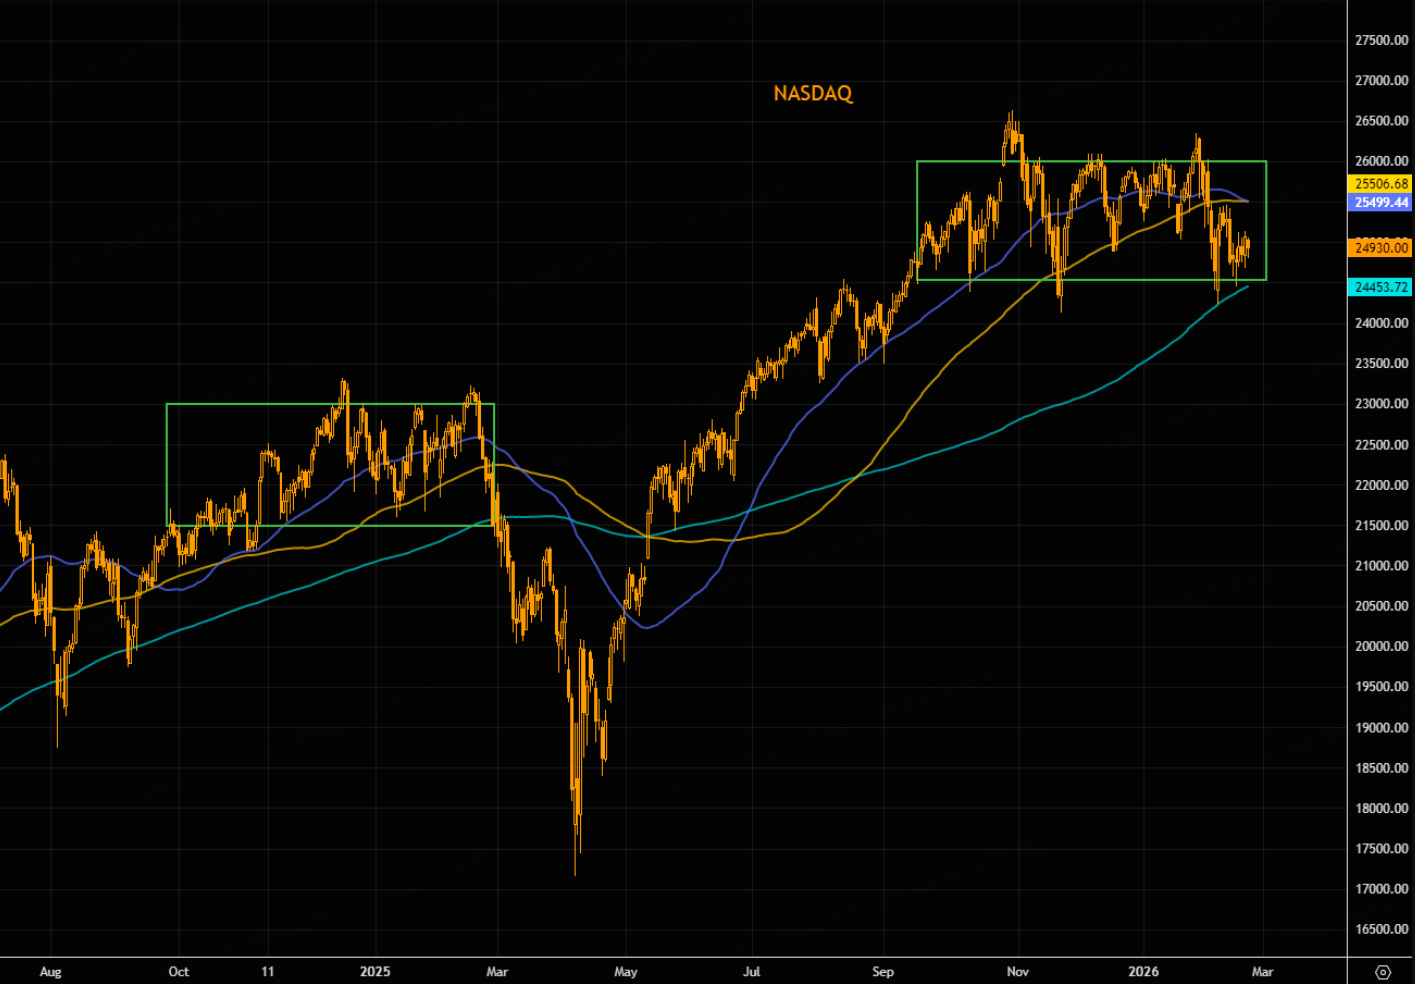
Next, look at the Nasdaq. Its structure is clearly weaker than the S&P, and the 50-day moving average has already crossed below the 100-day moving average. It increasingly looks like it could break below its range; if it does, the Nasdaq could pull the S&P down with it.
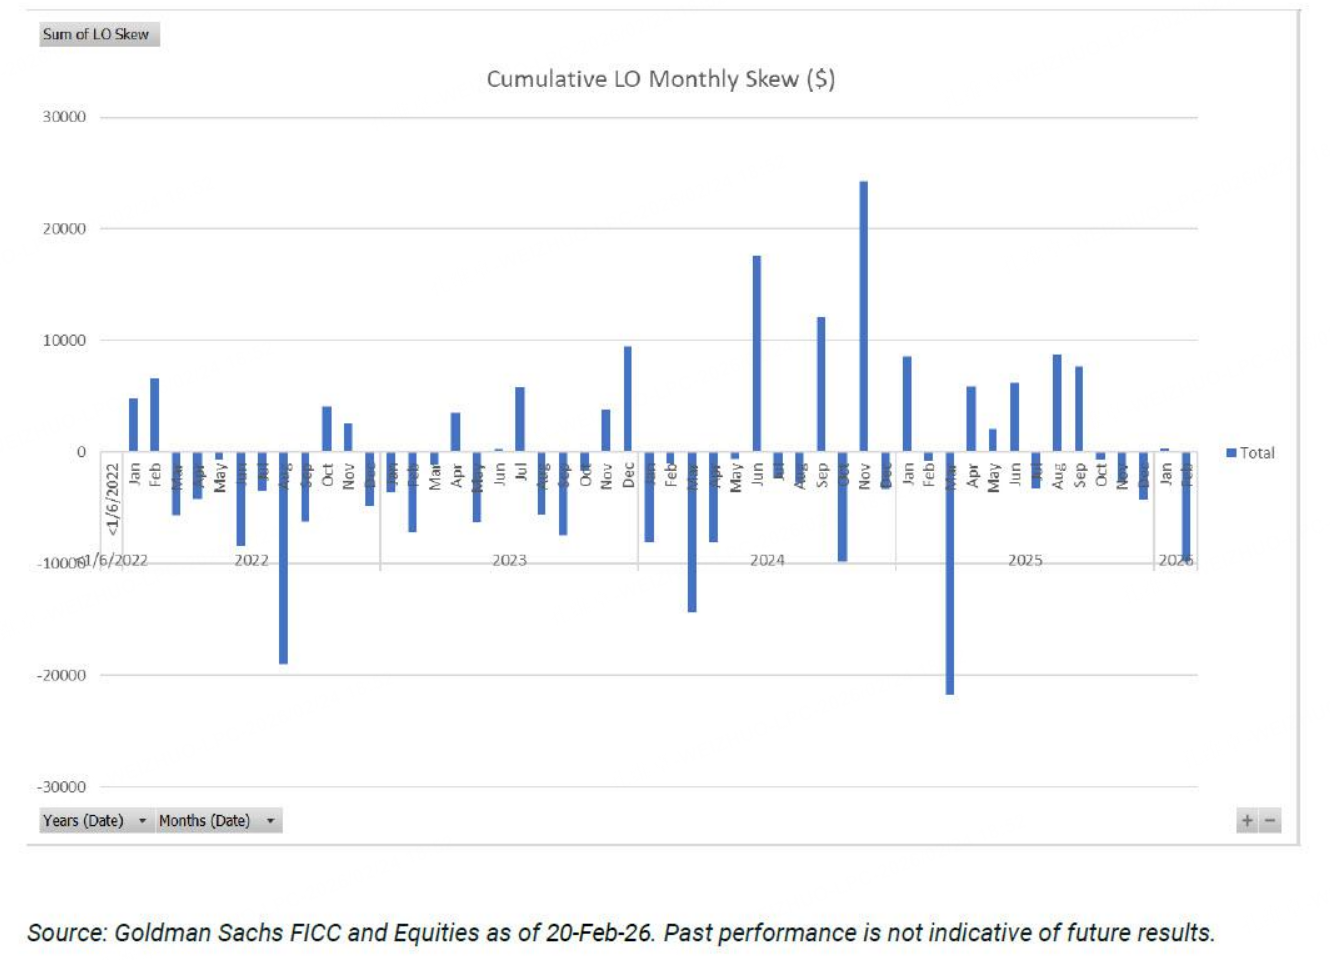
In addition, on fund flows, Goldman Sachs’ primary desk flow data show that asset managers, over the past two February trading days (monthly data through February 20), have seen a rare and sizable wave of selling, reaching the largest magnitude in nearly a year.
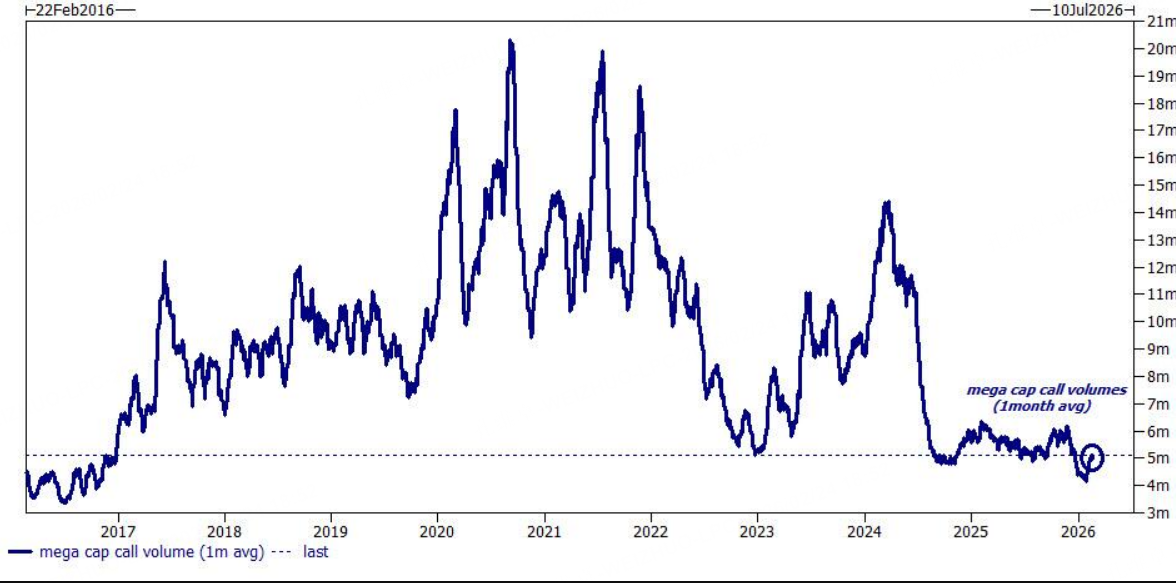
Separately, in options data, Goldman’s report also notes that call trading volume in large-cap stocks has almost fallen to historical lows, which is also an unusual condition.
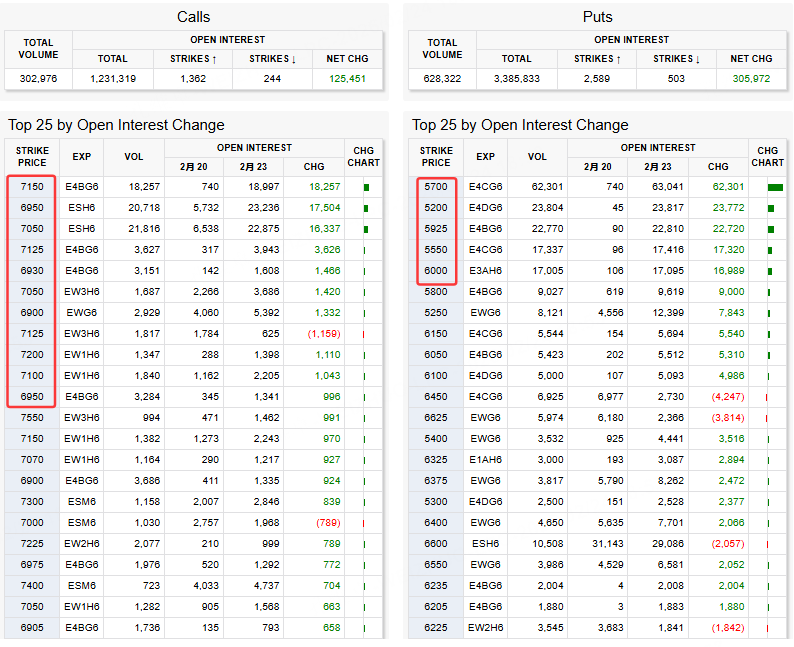
Now look at the latest S&P futures options trading distribution.
You can see that the largest increase on the call side is concentrated in strikes around 6900 to 7100, which very likely reflects selling calls to bet on a top. On the put side, volume is concentrated in deep out-of-the-money puts below 6000, which is also likely driven by traders actively selling far out-of-the-money puts.
$E-mini Dow Jones - main 2603(YMmain)$ $Micro E-mini Dow Jones - main 2603(MYMmain)$ $Dow Jones(.DJI)$ $Micro E-mini Dow Jones - Mar 2026(MYM2603)$
Therefore, my judgment is that over the next two weeks, the U.S. equity market is still likely to form a top and experience a meaningful decline. That said, this judgment still requires one execution signal: S&P futures must break below the 20-week moving average; before that happens, we should not be overly bearish on the index.
On sectors, we should be cautious with U.S. equity sectors that have higher leverage, and with sectors that have high P/E ratios but low growth. At the same time, we can look for value opportunities in sectors that appear undervalued—for example, I used AI to list P/E data for major sectors, with the data as of February 23, 2026.
$Energy Select Sector SPDR Fund(XLE)$ $Technology Select Sector SPDR Fund(XLK)$ $Real Estate Select Sector SPDR Fund(XLRE)$ $Consumer Discretionary Select Sector SPDR Fund(XLY)$
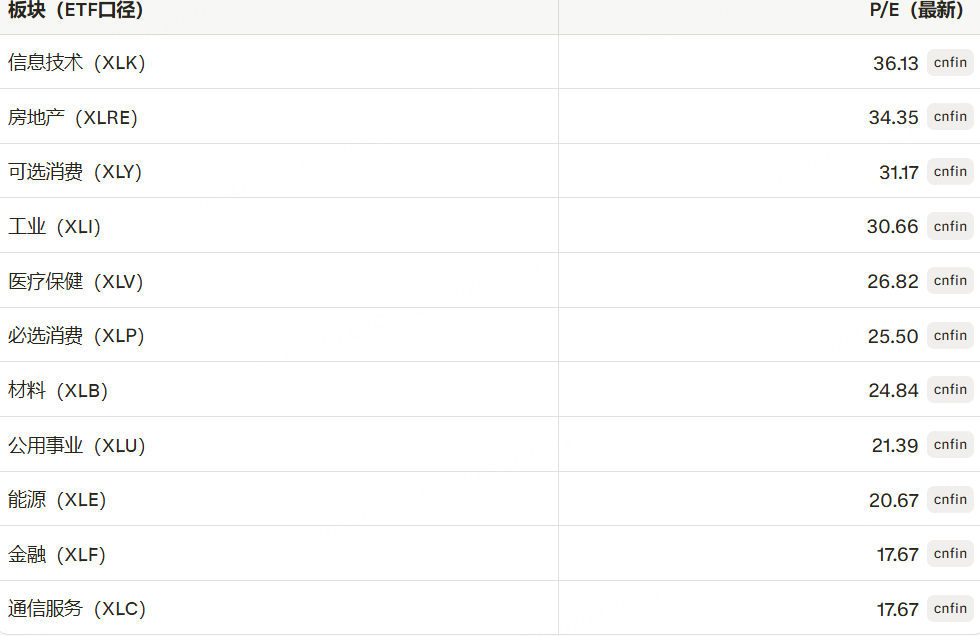
It is very clear that big tech looks too expensive, whether you look at leverage-based absolute valuation or earnings-multiple-based relative valuation. If you exclude big tech, you can see that the market is willing to assign higher valuations to real estate, consumer, industrials, healthcare, and materials.
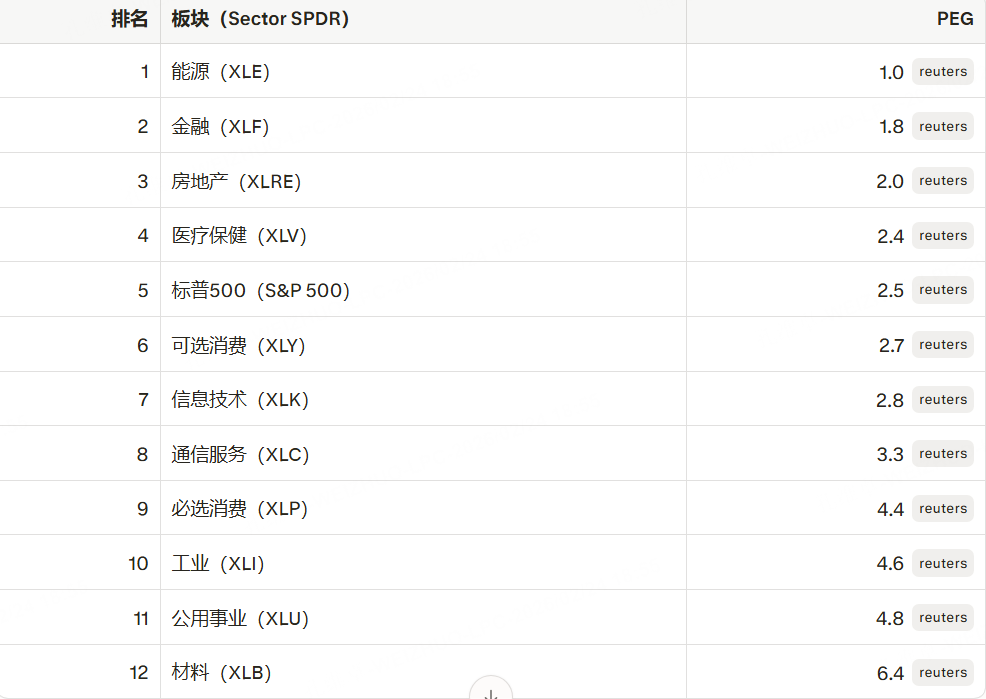
We also need one more dimension: the average growth rate of these sectors. If we rank sector valuation using the PEG metric, using data as of September 2025, we can see the sector PEG rankings. The most undervalued sector is energy, followed by financials, real estate, healthcare, and consumer discretionary—these are worth considering.
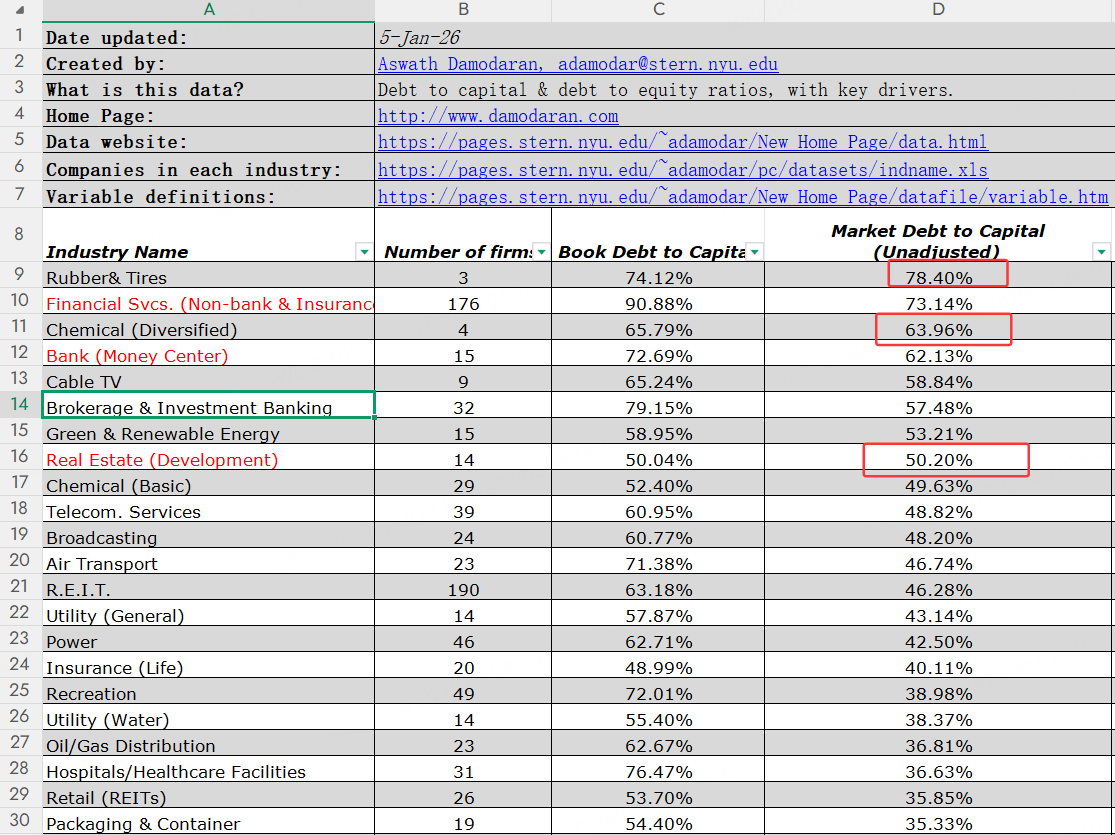
However, as I said, the concentration of risk in U.S. equities is still largely tied to Treasury yields: if yields spike, the market could see heavy selling. The selling would most likely be concentrated in sectors with high leverage、 high Market Debt to Capital Rate and high absolute valuations; among these, beyond big tech, both real estate and large financials also carry very high leverage overall. So after a simple filter, it seems that energy, healthcare, and consumer sectors are the ones most worth tracking.
Finally, a brief word on gold.
$Gold - main 2604(GCmain)$ $E-Micro Gold - main 2604(MGCmain)$ $1-Ounce Gold - main 2604(1OZmain)$
Among gold and silver, gold has been the most stable. Gold has already put in a second dip and then built a base, continuing higher; the bullish trend is very clear. In the short term, as long as U.S. equities remain weak and the market’s alarm continues to sound, gold will likely retest its prior high—so a downside break in equities could trigger two trading opportunities. But if U.S. equities keep drifting in this lukewarm, weak range, the market may remain stuck in a stalemate, and it will be difficult to find clean, trend-driven opportunities.
$Silver - main 2603(SImain)$ $E-mini Silver - main 2605(QImain)$ $Silver - Mar 2026(SI2603)$
Disclaimer: Investing carries risk. This is not financial advice. The above content should not be regarded as an offer, recommendation, or solicitation on acquiring or disposing of any financial products, any associated discussions, comments, or posts by author or other users should not be considered as such either. It is solely for general information purpose only, which does not consider your own investment objectives, financial situations or needs. TTM assumes no responsibility or warranty for the accuracy and completeness of the information, investors should do their own research and may seek professional advice before investing.
- DaveLewis·02-25Market feels shaky, holding my VIX tight. [龇牙]1Report