Two Major Opportunities: The Santa Rally and the Next Commodities Bull Run—What’s the Best Strategy?
After the policy outcomes from the Federal Reserve and the Bank of Japan were released, the market’s largest near-term risk window has largely passed.
Based on how price action has responded so far, the Santa rally has very likely begun; historically, it typically runs from late December into early January, and U.S. equities have a high probability of grinding higher with choppy gains during this period.
What’s more, while mega-cap tech looks expensive, the overall valuation of the equal-weight S&P 500 is not particularly stretched, so over the coming week it may be worth considering a strategy of selling weekly put options on Nasdaq futures with strikes below the 20-week moving average.At the same time, it also makes sense to prepare in advance for a potential explosive move in commodities next year.
Of course, a single-leg short option strategy has theoretically unlimited risk exposure, so it is necessary to set both strict stop-loss levels and time-window-based profit-taking targets.Next, the stop-loss/take-profit loop for this approach is discussed briefly in the context of the current index setup.
Risk events resolved: the biggest pressure has been released.
The two risks the market has been most focused on recently—the Fed’s FOMC meeting and the Bank of Japan meeting—have now played out, and neither delivered a tighter-than-expected shock.Although the Bank of Japan raised rates by 25 basis points, it did not provide a clear roadmap for continued hikes, and it again emphasized “data dependence” and “the risk that hiking too fast could hurt the economy and markets,” which reads as cautious and dovish rather than an aggressive tightening path.
A first clear post-event signal of this risk release was a sizable drop in the yen.This move is not viewed as the market pricing in “rate hikes will crush Japan’s economy” and selling defensively; it looks more like a short-term expression of traders’ disappointment with “mild hiking and no explicit hiking path,” followed by position covering.
The 25-bp hike itself has limited direct impact on global assets.In this environment, U.S. equities—especially the Nasdaq—have room to keep rebounding, and the Santa rally has the conditions to unfold and extend.
Watching the Santa-rally window.
After the BOJ’s dovish hike, global capital has clearly tilted toward U.S. equities in the short run.According to Bank of America Securities strategist Michael Hartnett’s fund-flow report, net inflows into U.S. equities in the past week were the second-highest in nearly three years, and year-to-date inflows into U.S. equity ETFs hit the highest level since 2015—signaling optimism from both institutions and passive flows about the near-term outlook for U.S. stocks.
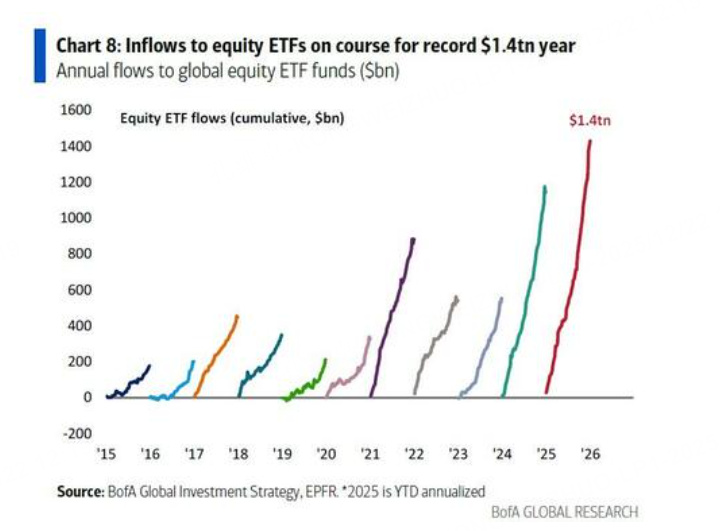
The view here is that, during the phase when the U.S. government has reopened and liquidity is temporarily stable, this trend may persist until the end of the government’s funding extension in January.However, the more aggressive the inflows, the more important it becomes to stay alert to potential liquidity tightening again.
Seasonally, the VIX often bottoms and then rises again by late January, which implies that today’s low-volatility regime is supportive of the Santa rally, but any liquidity disturbance or risk event early next year could push volatility higher and trigger a short-term drawdown.
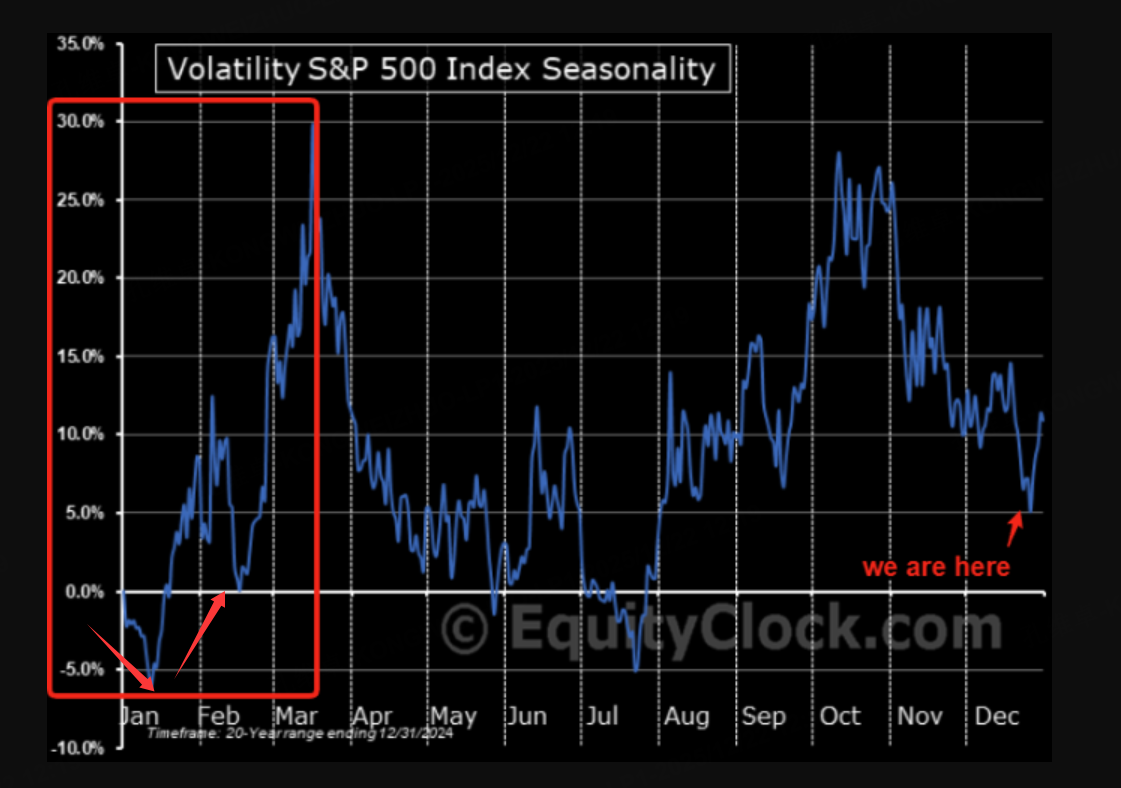
Given this seasonal structure, a more reasonable framework is: during the Santa-rally phase, volatility tends to stay low and U.S. equities trend upward in a choppy fashion; from mid-January onward, it becomes necessary to guard against a “bottoming then rising” VIX regime and the correction risk that can come with it.
At the same time, U.S. equities show clear valuation dispersion: large-cap tech—driven by AI and growth premiums—already sits in relatively high valuation territory, while the equal-weight S&P 500 is not at an extreme.Looking across the last decade, the S&P 500’s P/E and price-to-sales are elevated on a cap-weighted basis because mega-cap tech has lifted the index, but on an equal-weight basis valuations look materially more attractive than the 2021 peak.
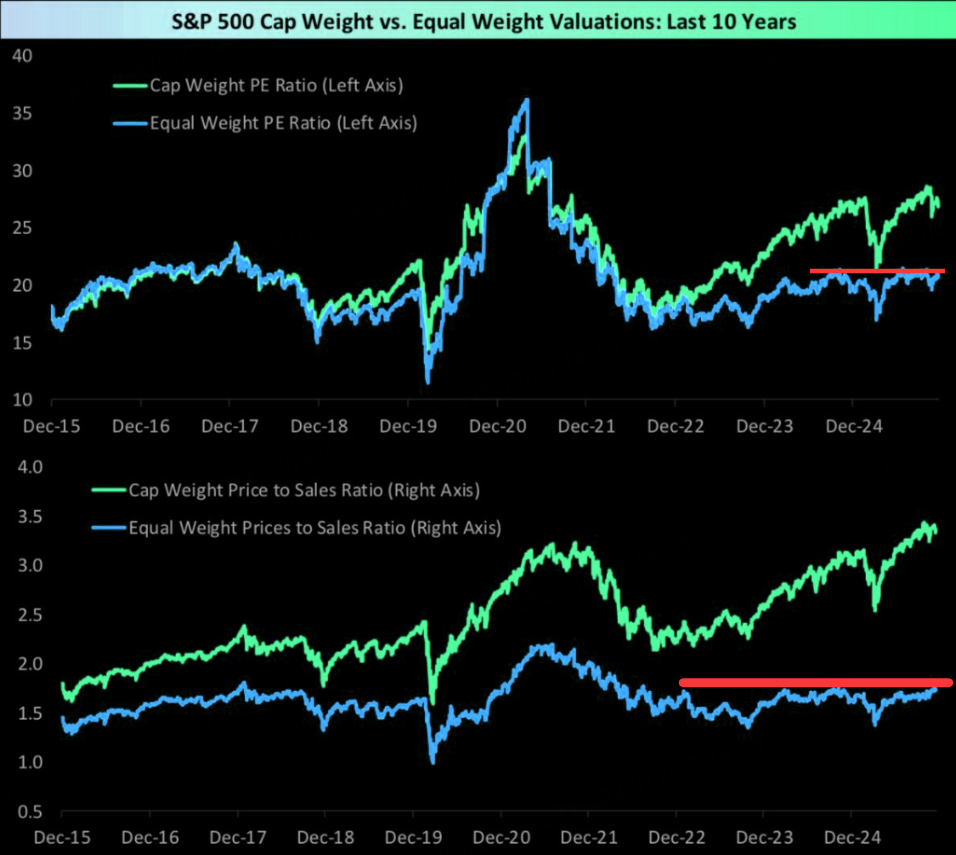
This means that, at the index level, mega-cap tech makes “the index look expensive,” while the broader set of mid- and smaller-weight constituents is “not broadly expensive,” which supports a base case of a choppy upward bias for the overall U.S. market.From a strategy standpoint, the risk of chasing mega-cap tech higher is that there is limited room left for valuation expansion and drawdowns can be sharp; a more suitable approach is selling puts to gain a more cost-effective entry zone on pullbacks.
Strategy: roll short downside puts, but respect the time boundary.
With the combination of “the biggest risk window has passed + the Santa rally is unfolding + equal-weight valuations are not high,” the main strategy is straightforward: roll a short position in low-strike index puts.In practice, the underlying can be Nasdaq futures or index ETFs such as QQQ; sell weekly puts with strikes below the 20-week moving average to collect time value, because over the next one to two weeks—absent surprises—the 20-week moving average is likely to hold.
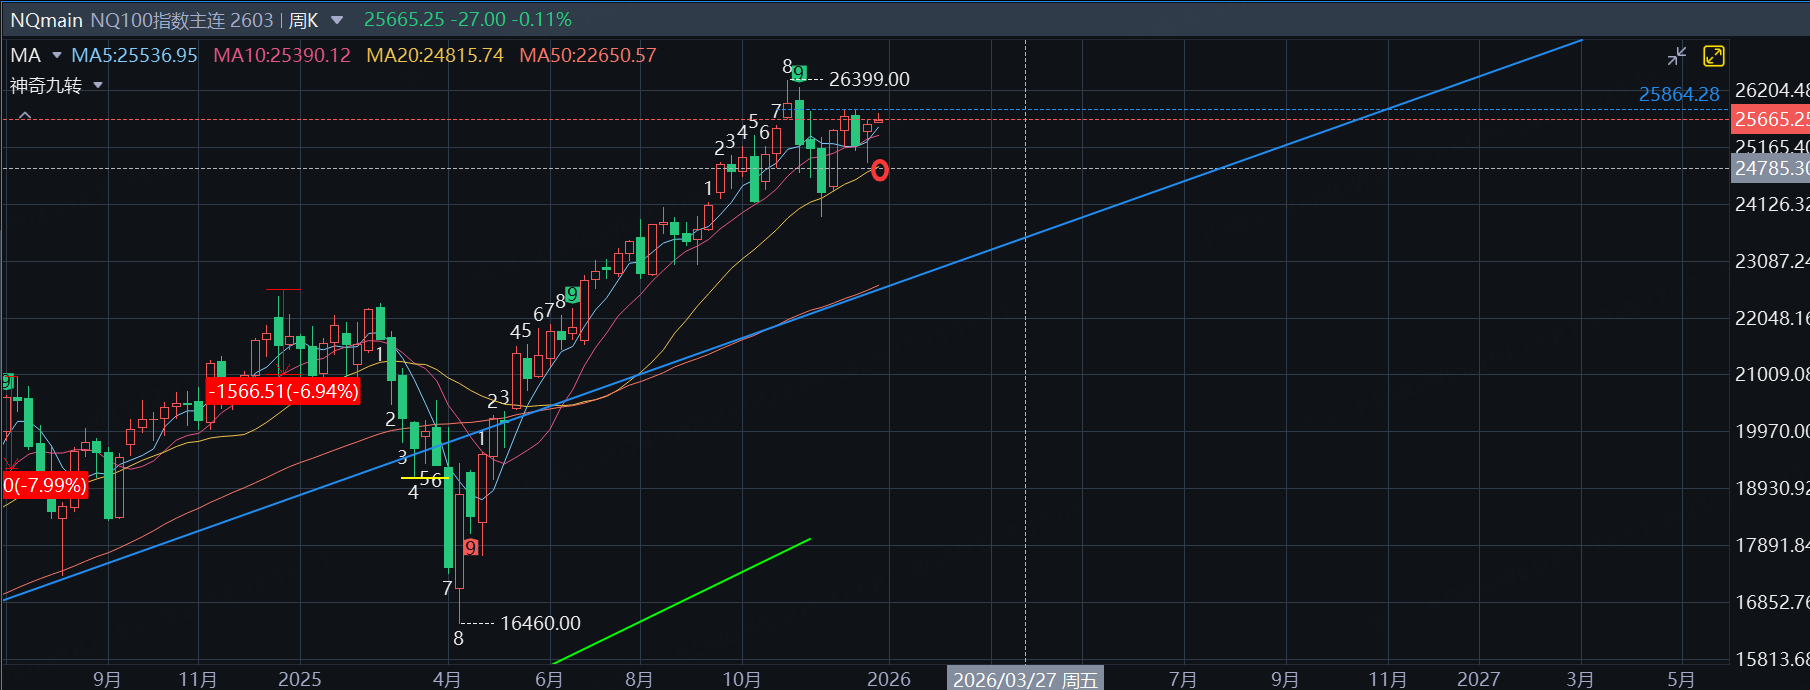
A critical point is that this Santa-rally trade has a clear seasonal boundary; after January begins, this put-selling strategy should be gradually harvested to avoid running head-on into a potential volatility up-cycle.Historically, the current period fits the classic “Santa Claus rally” window: it generally starts on December 24 and covers the last five trading days of December plus the first two trading days of the next January.
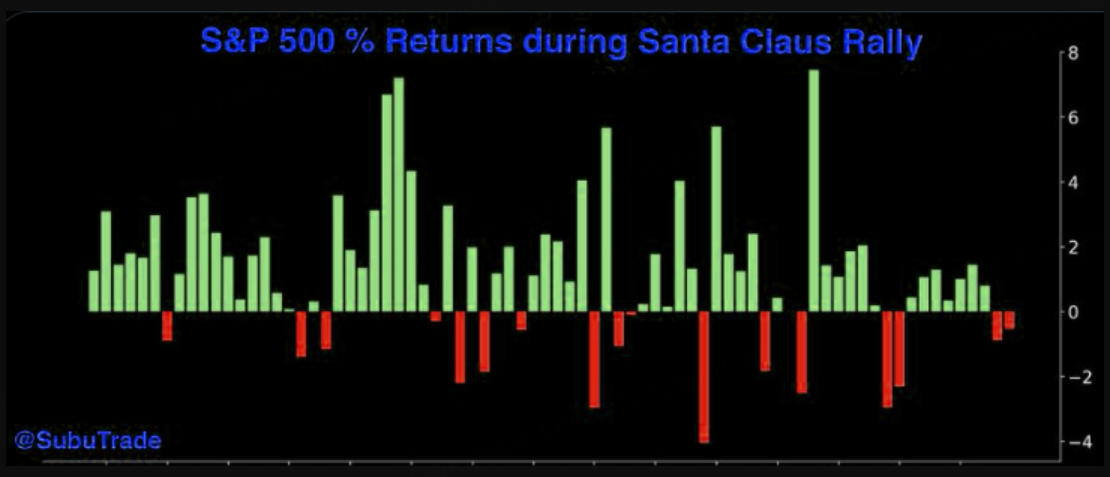
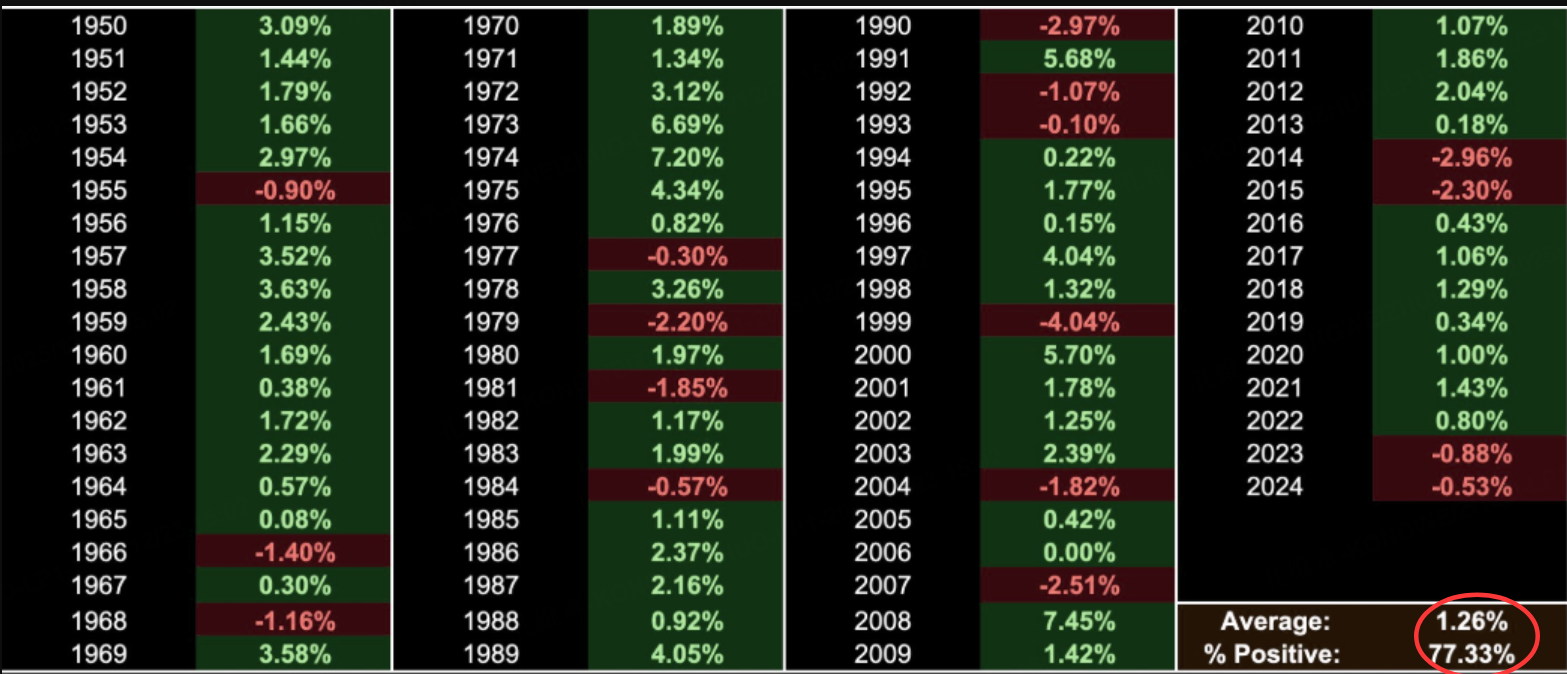
S&P 500% Returns during Santa Claus Rally.During this window, the S&P 500 has a 77% probability of rising.From year-by-year data since 1950, most years deliver positive returns over these seven days, with an average gain of about 1.26%.Historically, there has never been a case of three consecutive down days during this window, and large single-year declines are typically tied to special-event backdrops.
Based on this, the stop-loss and take-profit for the single-leg short index put strategy can be framed as follows:
Use Nasdaq futures options or ETF options as the trading vehicle, use S&P futures as the stop reference, and cut the position promptly if the main continuous S&P futures contract breaks below its 20-day moving average.Then, after January begins, gradually reduce exposure to lock in gains as profit-taking, and fully close the strategy’s position in the first week after New Year’s Day to guard against valuation compression and price pullbacks driven by seasonal volatility from mid-to-late January.
Finally: commodities may be ready for a second wave.
One more point to note is that commodities may be on the verge of a second breakout.As highlighted in the previous analysis, commodities are currently at the edge of a potential surge:
The core cyclical chain is: broad commodity up-cycles are usually kicked off by gold, then transmitted to copper, and then copper’s rise pulls crude oil into a catch-up rally.
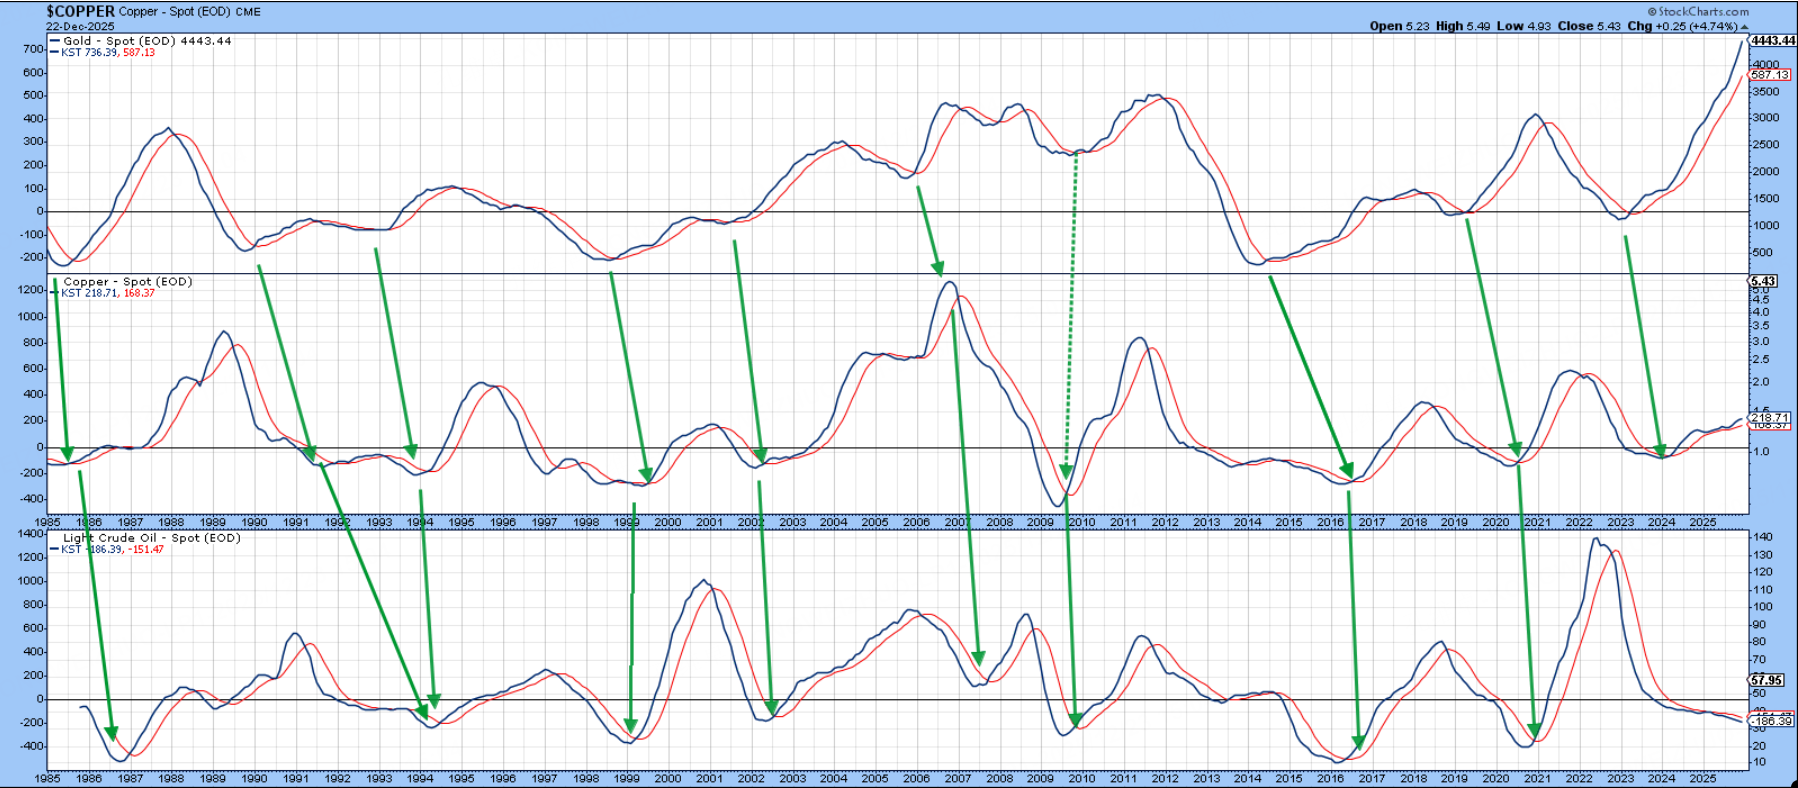
The charts above show the historical performance of gold, copper, and crude oil since the 1980s, and multiple commodity bull markets reflect this “gold → copper → crude oil” relay.
Gold has already accumulated substantial gains and faces clear resistance near prior historical highs, so a further immediate breakout is not easy, but this may suggest that in the commodity cycle, broader commodities could take over from gold as the next “lead indicator” asset.
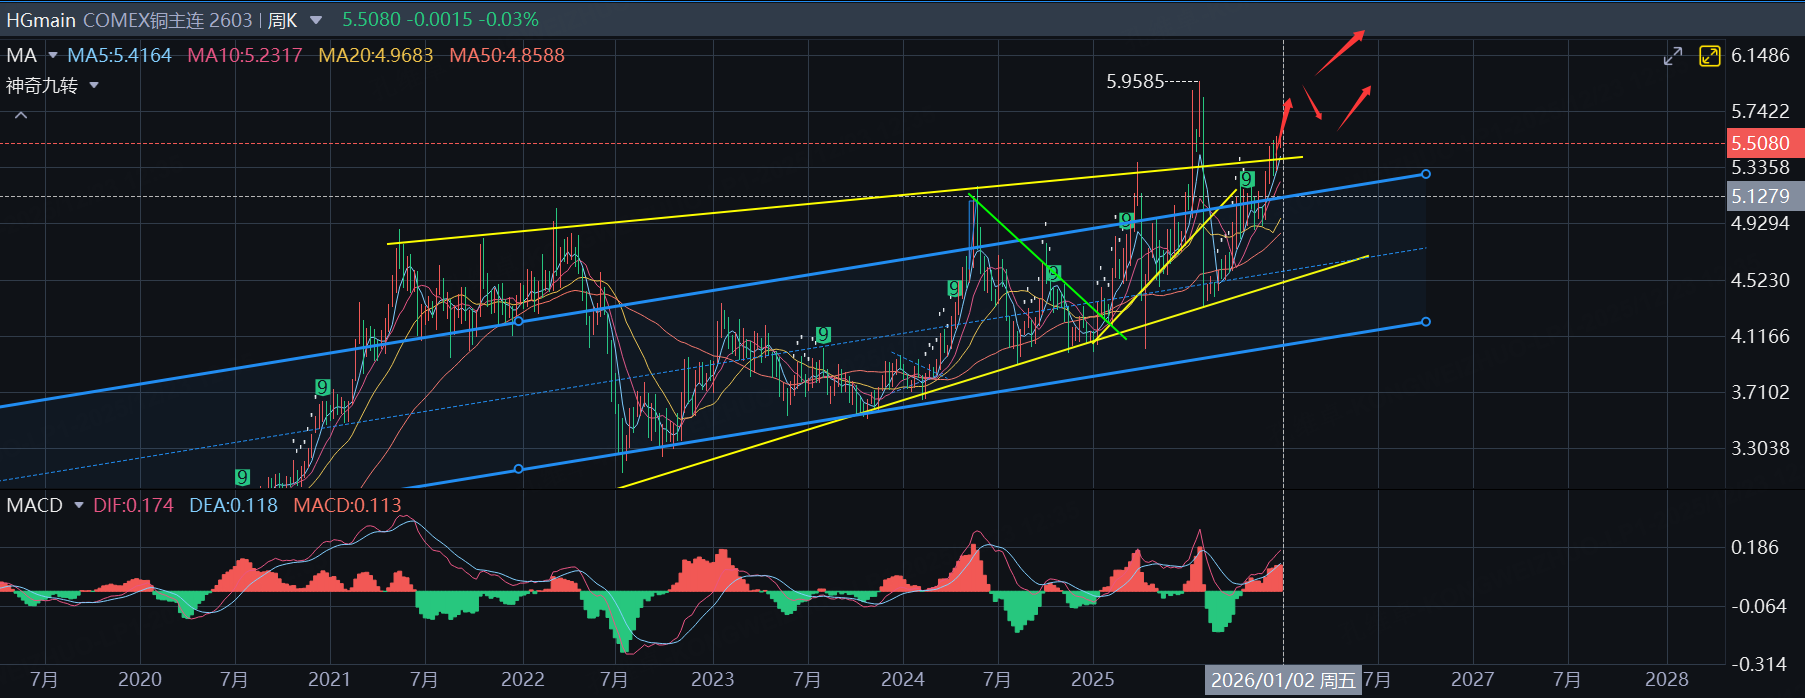
In the short term, pay attention to copper’s breakout.On the daily timeframe, the COMEX copper continuous contract has been oscillating higher along the 5-day moving average, so “staying long along the 5-day line” remains a valid short-term trading approach.
On the weekly chart, copper has been rising after years of lengthy consolidation, and once it breaks above the “yellow resistance line” and holds above the prior high without clear rejection, it would further validate the view that “commodities are about to break out across the board.”
$NQ100指数主连 2603(NQmain)$ $SP500指数主连 2603(ESmain)$ $道琼斯指数主连 2603(YMmain)$ $COMEX铜主连 2603(HGmain)$ $黄金主连 2602(GCmain)$ $白银主连 2603(SImain)$
Disclaimer: Investing carries risk. This is not financial advice. The above content should not be regarded as an offer, recommendation, or solicitation on acquiring or disposing of any financial products, any associated discussions, comments, or posts by author or other users should not be considered as such either. It is solely for general information purpose only, which does not consider your own investment objectives, financial situations or needs. TTM assumes no responsibility or warranty for the accuracy and completeness of the information, investors should do their own research and may seek professional advice before investing.
- NatalieTommy·2025-12-23Santa rally loading up, commodities breakout next? Let's ride the wave! [得意][看涨]LikeReport